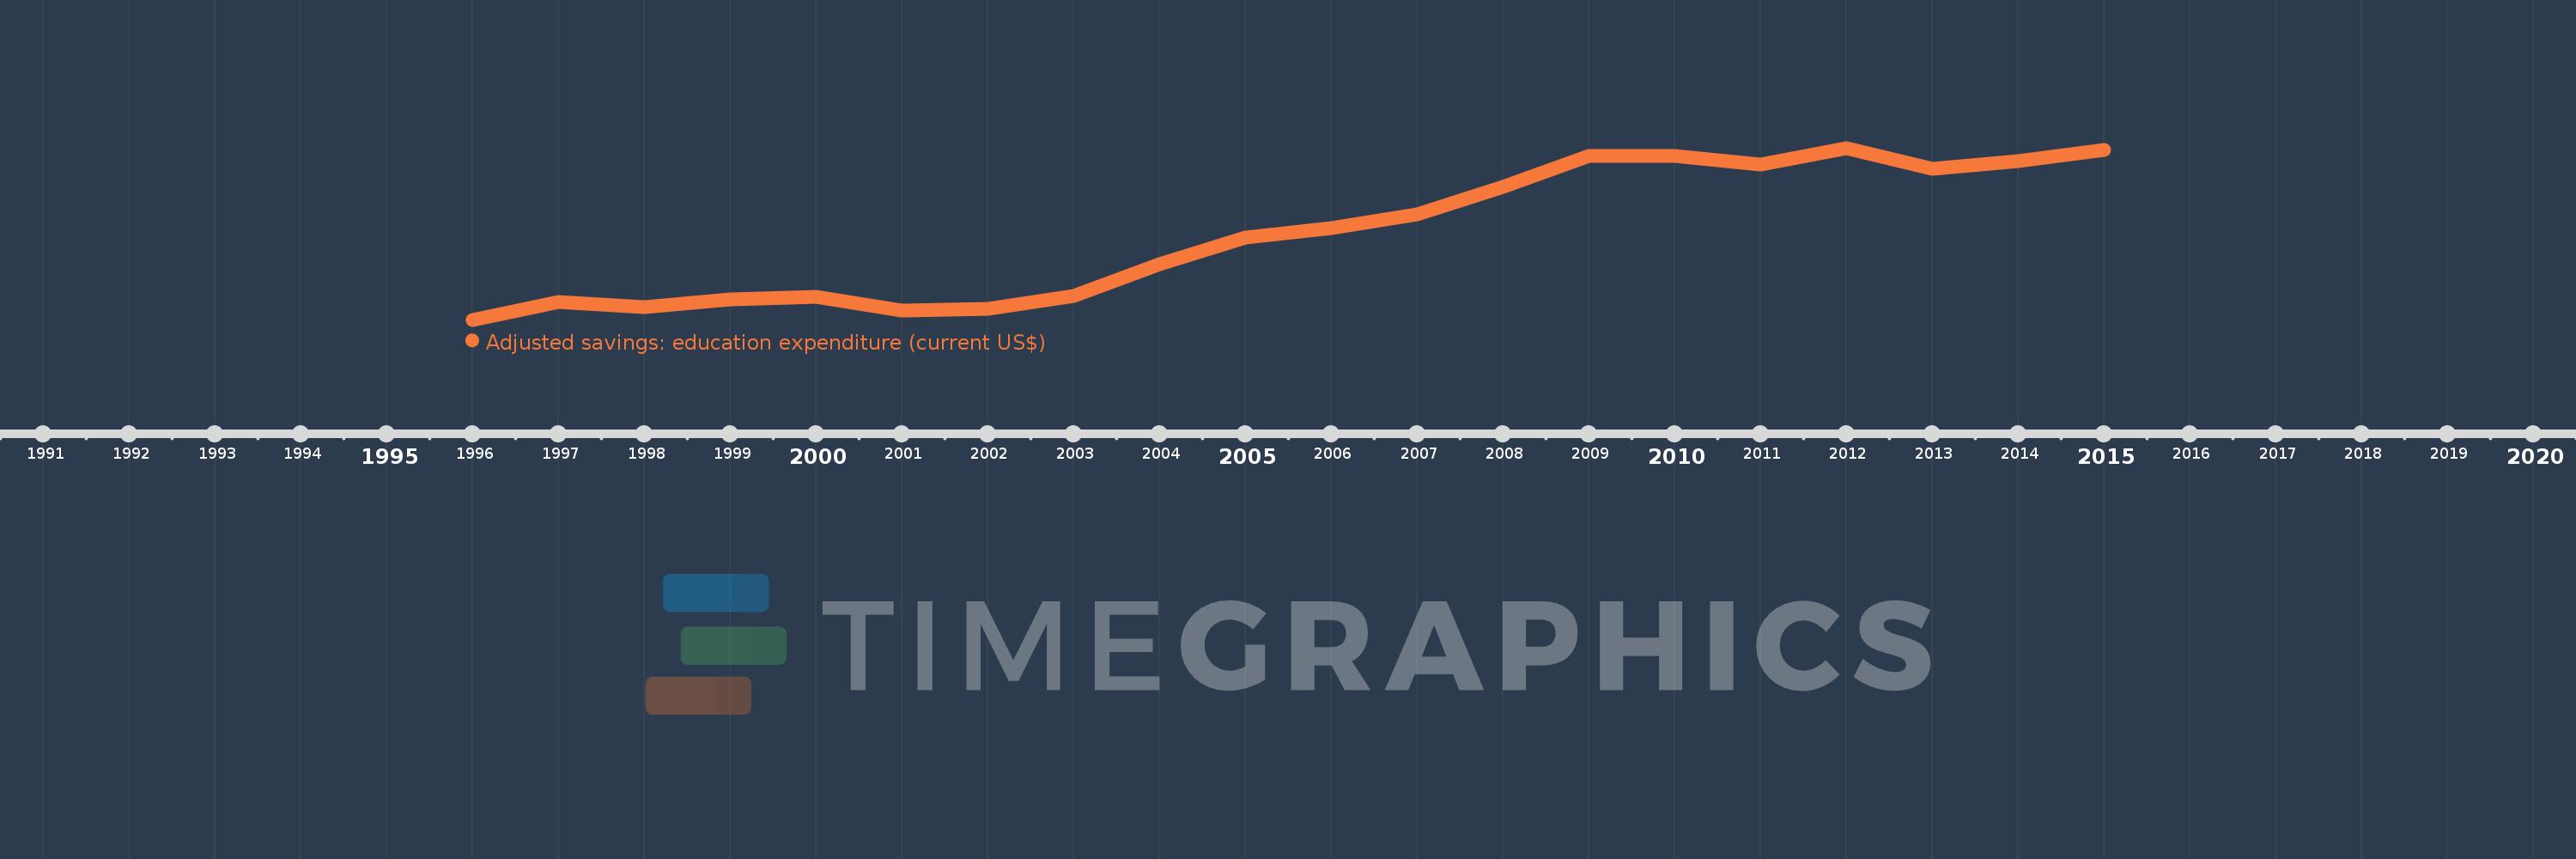
This timeline shows a graph from 1996 to 2015 of Slovenia. No data until 1995. Number of actual observations by date: 20.
Source name:
World Development Indicators
Source organization:
World Bank staff estimates using data from the United Nations Statistics Division's Statistical Yearbook, and the UNESCO Institute for Statistics online database.
Categories, topics:
Economy & Growth, Environment
Last updated:
apr 23, 2017
Indicators value changes by year
Meaning:
1.828 bln
Minimum:
988.881 mln
jan 1, 1996
Maximum:
2.666 bln
jan 1, 2012
At the date of observation
Value
Absolute change
Change from the previous value
jan 1, 1996
988.881 mln
+988.881 mln
0.0%
jan 1, 1997
1.159 bln
+170.547 mln
17.25%
jan 1, 1998
1.116 bln
-43.48 mln
-3.75%
jan 1, 1999
1.188 bln
+72.374 mln
6.49%
jan 1, 2000
1.212 bln
+23.213 mln
1.95%
jan 1, 2001
1.077 bln
-134.729 mln
-11.12%
jan 1, 2002
1.099 bln
+22.443 mln
2.08%
jan 1, 2003
1.223 bln
+123.474 mln
11.23%
jan 1, 2004
1.528 bln
+304.823 mln
24.93%
jan 1, 2005
1.794 bln
+266.804 mln
17.47%
jan 1, 2006
1.883 bln
+88.177 mln
4.91%
jan 1, 2007
2.02 bln
+137.921 mln
7.33%
jan 1, 2008
2.288 bln
+267.319 mln
13.23%
jan 1, 2009
2.585 bln
+297.259 mln
12.99%
jan 1, 2010
2.588 bln
+2.642 mln
0.1%
jan 1, 2011
2.502 bln
-85.513 mln
-3.3%
jan 1, 2012
2.666 bln
+163.952 mln
6.55%
jan 1, 2013
2.461 bln
-205.223 mln
-7.7%
jan 1, 2014
2.541 bln
+80.234 mln
3.26%
jan 1, 2015
2.649 bln
+107.485 mln
4.23%
Ranking of countries by current statistics by years