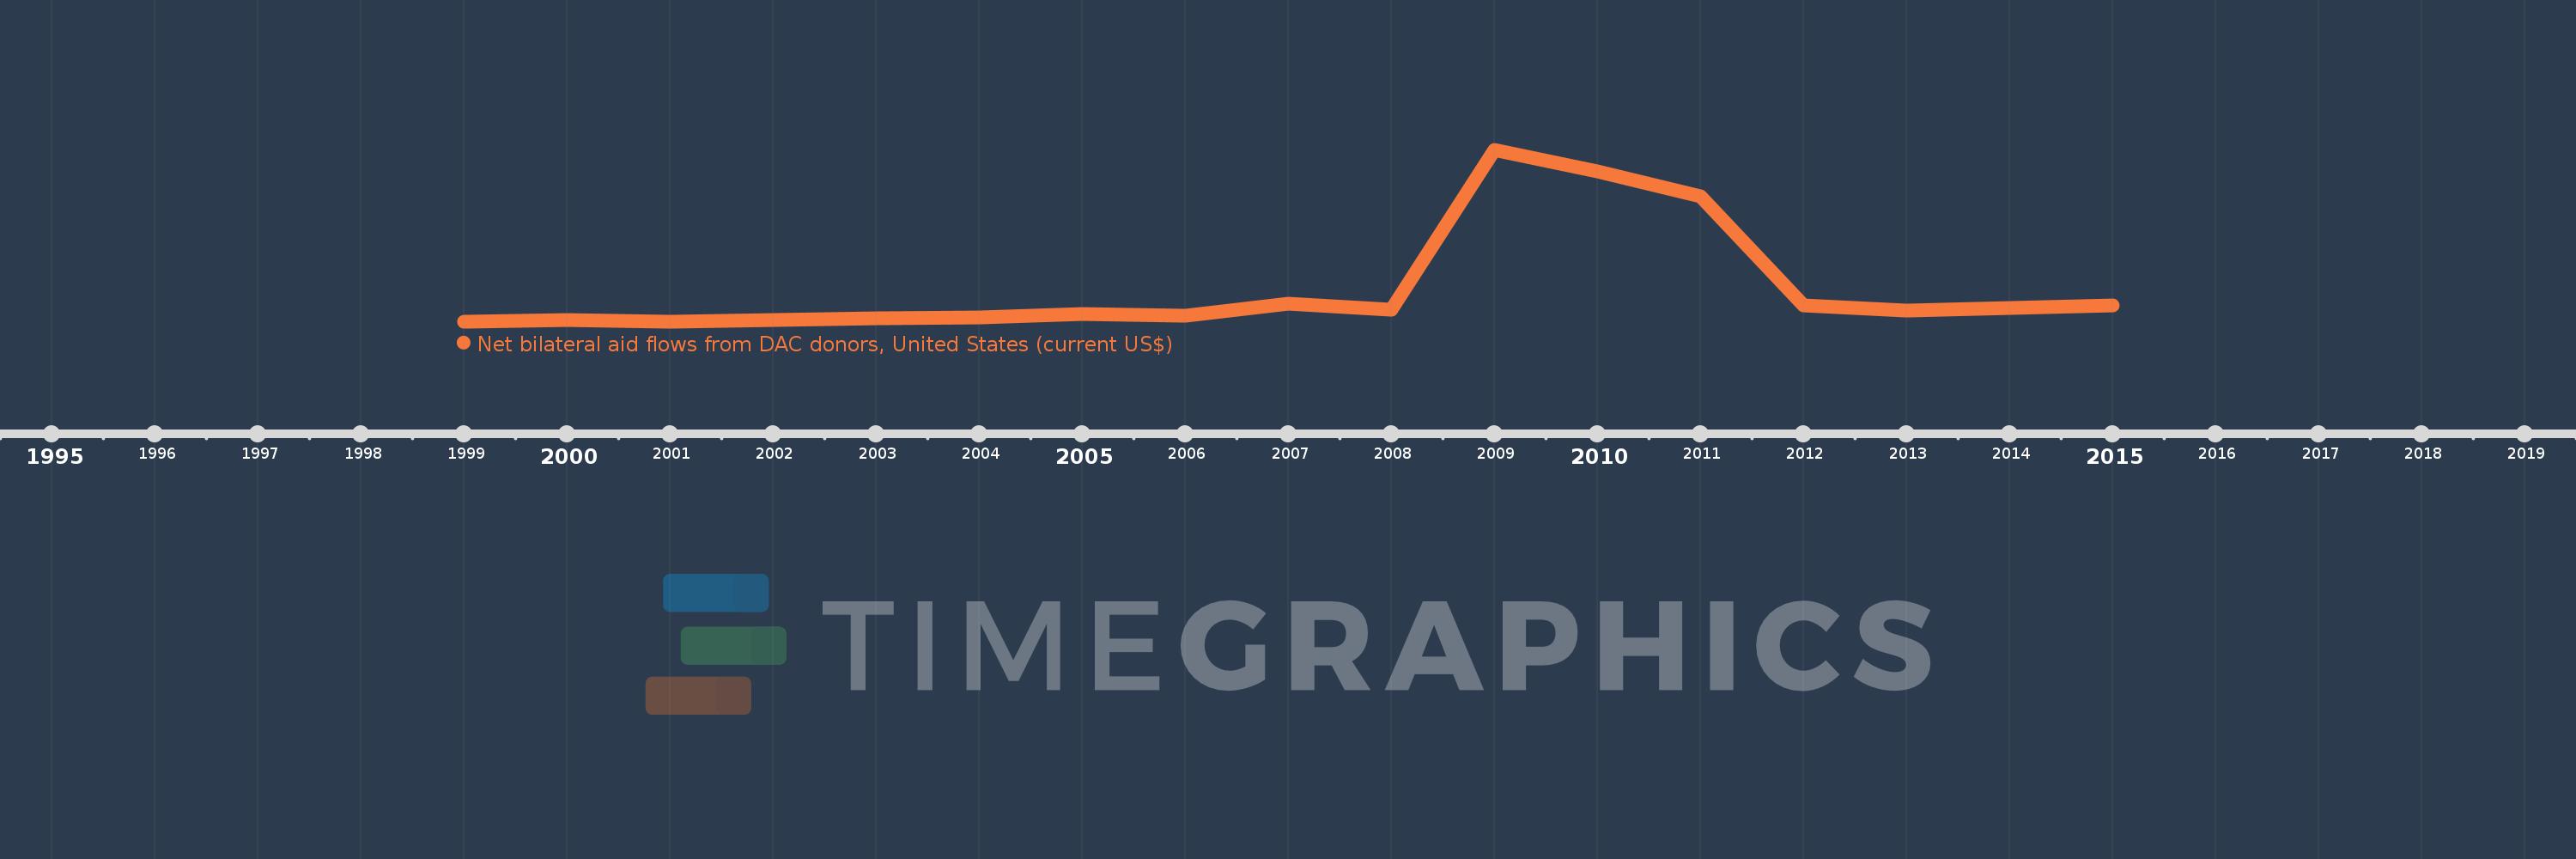
This timeline shows a graph from 1999 to 2015 of Vanuatu. No data until 1998. Number of actual observations by date: 17.
Source name:
World Development Indicators
Source organization:
Development Assistance Committee of the Organisation for Economic Co-operation and Development, Geographical Distribution of Financial Flows to Developing Countries, Development Co-operation Report, and International Development Statistics database. Data are available online at: www.oecd.org/dac/stats/idsonline.
Categories, topics:
Aid Effectiveness
Last updated:
apr 23, 2017
Indicators value changes by year
Meaning:
5.455 mln
Minimum:
560.0K
jan 1, 2001
Maximum:
25.88 mln
jan 1, 2009
At the date of observation
Value
Absolute change
Change from the previous value
jan 1, 1999
660.0K
+660.0K
0.0%
jan 1, 2000
810.0K
+150.0K
22.73%
jan 1, 2001
560.0K
-250.0K
-30.86%
jan 1, 2002
890.0K
+330.0K
58.93%
jan 1, 2003
1.06 mln
+170.0K
19.1%
jan 1, 2004
1.21 mln
+150.0K
14.15%
jan 1, 2005
1.78 mln
+570.0K
47.11%
jan 1, 2006
1.52 mln
-260.0K
-14.61%
jan 1, 2007
3.23 mln
+1.71 mln
112.5%
jan 1, 2008
2.33 mln
-900.0K
-27.86%
jan 1, 2009
25.88 mln
+23.55 mln
1.01K%
jan 1, 2010
22.76 mln
-3.12 mln
-12.06%
jan 1, 2011
19.13 mln
-3.63 mln
-15.95%
jan 1, 2012
3.0 mln
-16.13 mln
-84.32%
jan 1, 2013
2.21 mln
-790.0K
-26.33%
jan 1, 2014
2.67 mln
+460.0K
20.81%
jan 1, 2015
3.03 mln
+360.0K
13.48%
Ranking of countries by current statistics by years