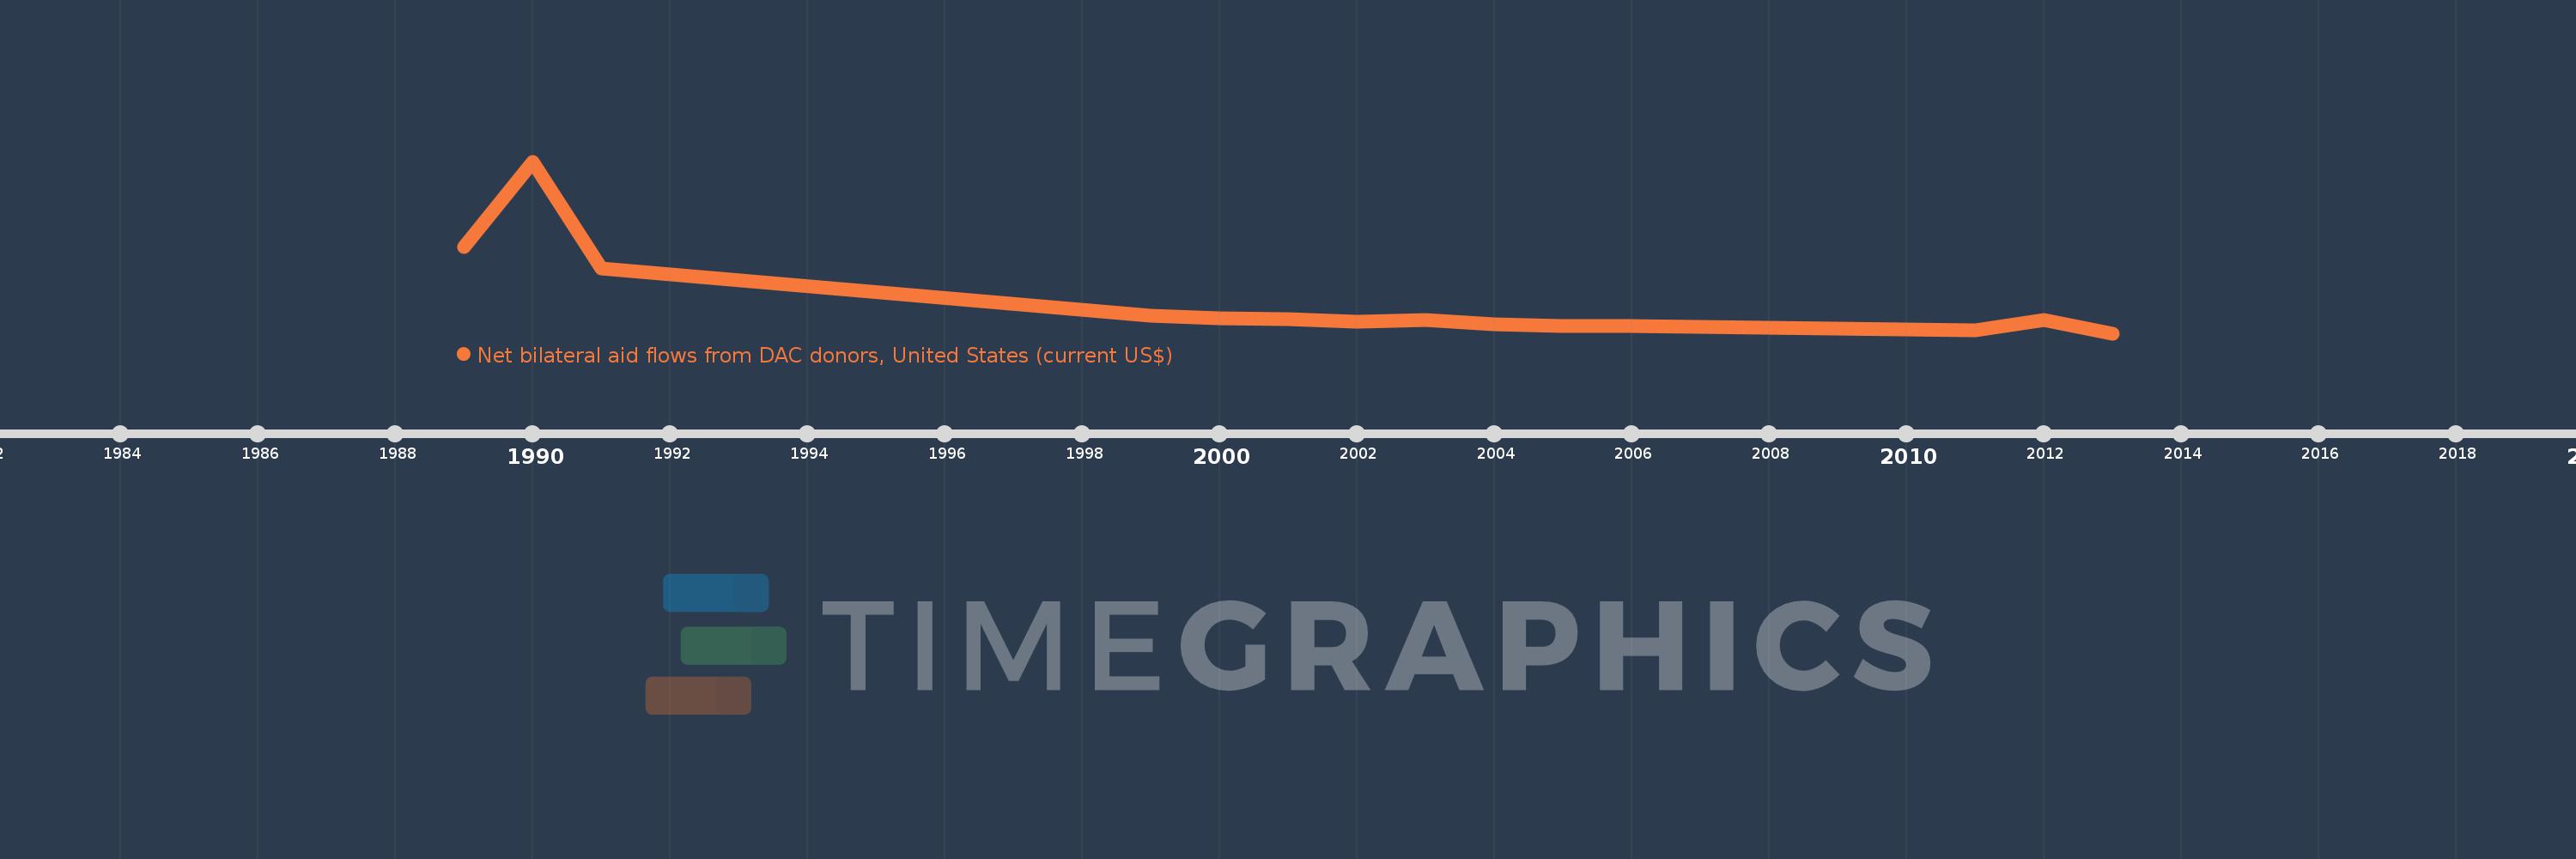
This timeline shows a graph from 1989 to 2013 of St. Kitts and Nevis. No data until 1988. Number of actual observations by date: 18.
Source name:
World Development Indicators
Source organization:
Development Assistance Committee of the Organisation for Economic Co-operation and Development, Geographical Distribution of Financial Flows to Developing Countries, Development Co-operation Report, and International Development Statistics database. Data are available online at: www.oecd.org/dac/stats/idsonline.
Categories, topics:
Aid Effectiveness
Last updated:
apr 23, 2017
Indicators value changes by year
Meaning:
155.556K
Minimum:
-1.03 mln
jan 1, 2013
Maximum:
7.0 mln
jan 1, 1990
At the date of observation
Value
Absolute change
Change from the previous value
jan 1, 1989
3.0 mln
+3.0 mln
0.0%
jan 1, 1990
7.0 mln
+4.0 mln
133.33%
jan 1, 1991
2.0 mln
-5.0 mln
-71.43%
jan 1, 1999
-190.0K
-2.19 mln
-109.5%
jan 1, 2000
-310.0K
-120.0K
63.16%
jan 1, 2001
-380.0K
-70.0K
22.58%
jan 1, 2002
-470.0K
-90.0K
23.68%
jan 1, 2003
-390.0K
+80.0K
-17.02%
jan 1, 2004
-620.0K
-230.0K
58.97%
jan 1, 2005
-670.0K
-50.0K
8.06%
jan 1, 2006
-700.0K
-30.0K
4.48%
jan 1, 2007
-730.0K
-30.0K
4.29%
jan 1, 2008
-770.0K
-40.0K
5.48%
jan 1, 2009
-810.0K
-40.0K
5.19%
jan 1, 2010
-850.0K
-40.0K
4.94%
jan 1, 2011
-890.0K
-40.0K
4.71%
jan 1, 2012
-390.0K
+500.0K
-56.18%
jan 1, 2013
-1.03 mln
-640.0K
164.1%
Ranking of countries by current statistics by years