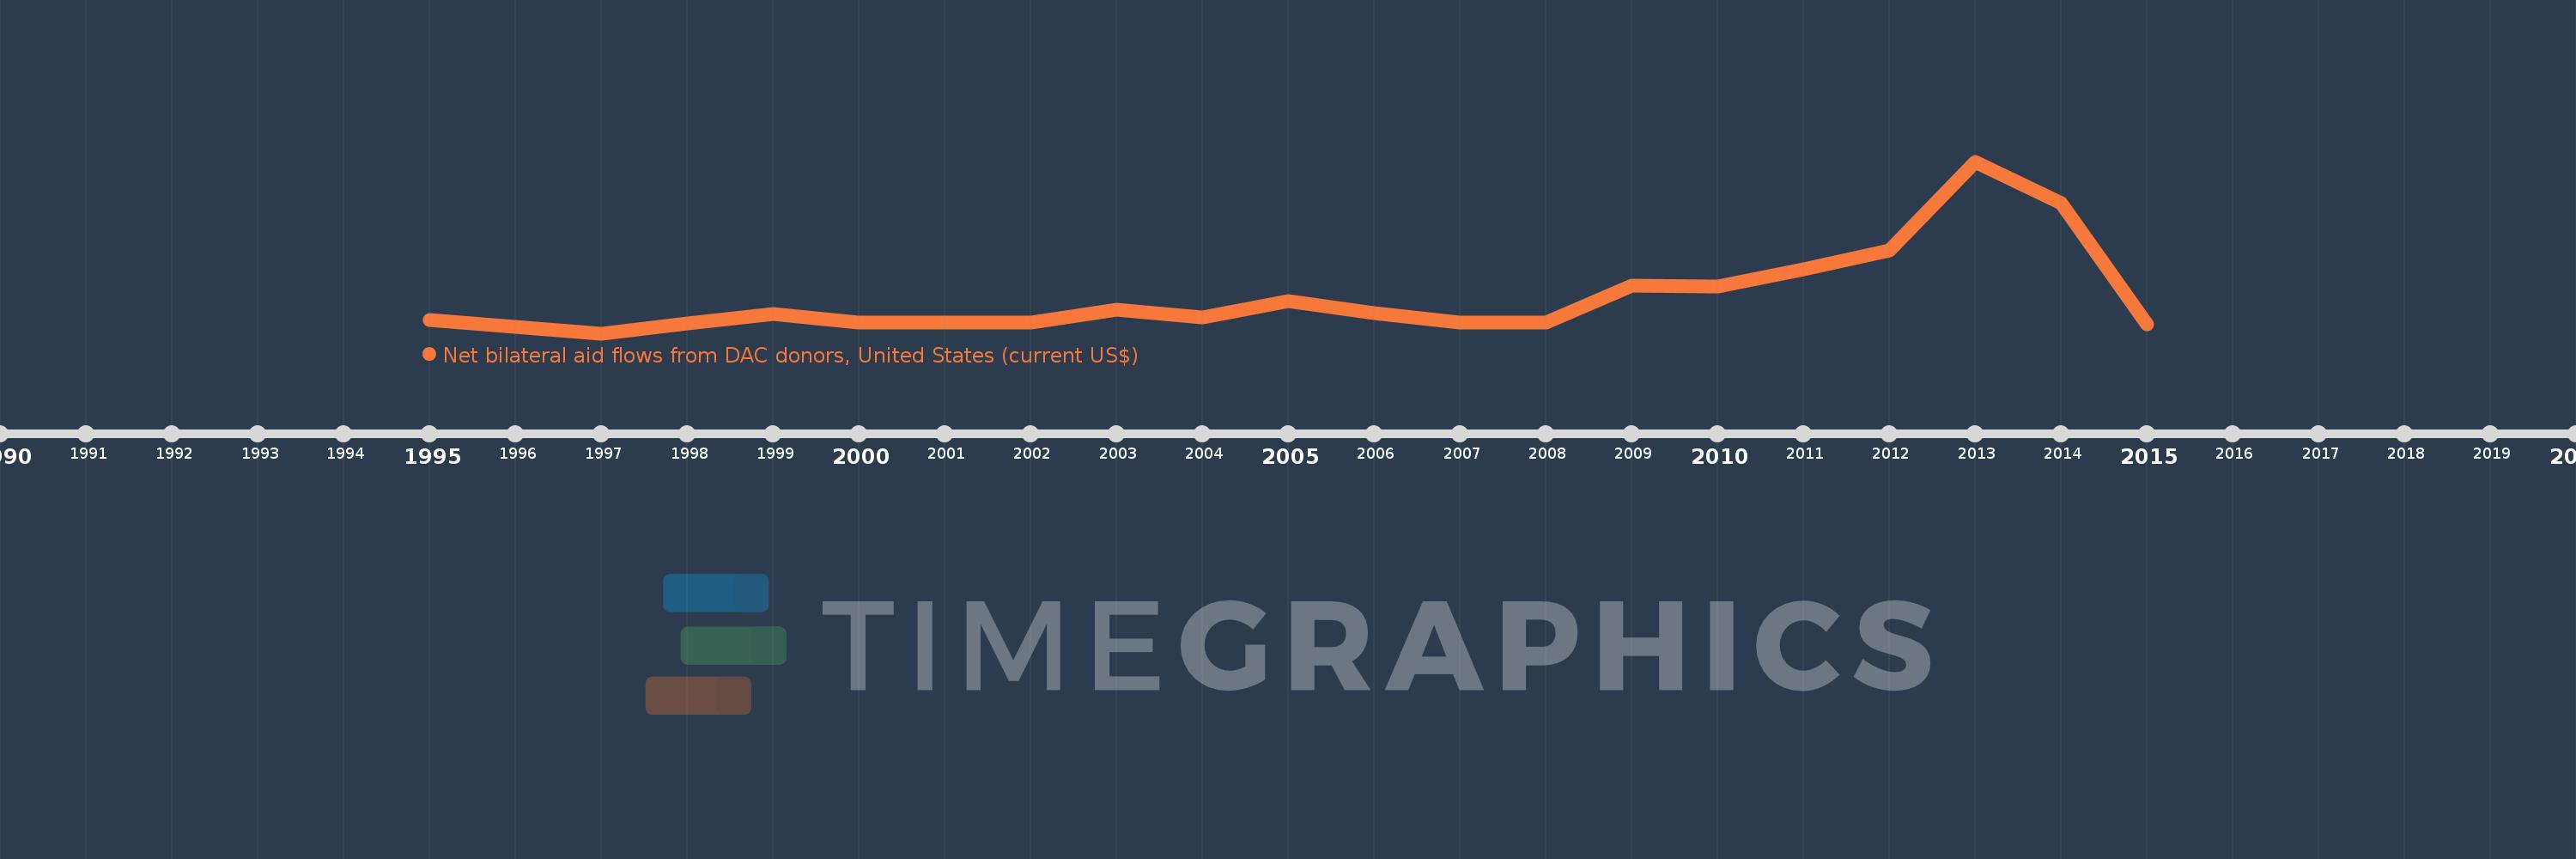
This timeline shows a graph from 1995 to 2015 of Mongolia. No data until 1994. Number of actual observations by date: 20.
Source name:
World Development Indicators
Source organization:
Development Assistance Committee of the Organisation for Economic Co-operation and Development, Geographical Distribution of Financial Flows to Developing Countries, Development Co-operation Report, and International Development Statistics database. Data are available online at: www.oecd.org/dac/stats/idsonline.
Categories, topics:
Aid Effectiveness
Last updated:
apr 23, 2017
Indicators value changes by year
Meaning:
28.884 mln
Minimum:
6.0 mln
jan 1, 1997
Maximum:
112.43 mln
jan 1, 2013
At the date of observation
Value
Absolute change
Change from the previous value
jan 1, 1995
14.0 mln
+14.0 mln
0.0%
jan 1, 1997
6.0 mln
-8.0 mln
-57.14%
jan 1, 1998
12.0 mln
+6.0 mln
100.0%
jan 1, 1999
17.71 mln
+5.71 mln
47.58%
jan 1, 2000
12.5 mln
-5.21 mln
-29.42%
jan 1, 2001
12.59 mln
+90.0K
0.72%
jan 1, 2002
12.74 mln
+150.0K
1.19%
jan 1, 2003
20.43 mln
+7.69 mln
60.36%
jan 1, 2004
16.08 mln
-4.35 mln
-21.29%
jan 1, 2005
25.9 mln
+9.82 mln
61.07%
jan 1, 2006
18.53 mln
-7.37 mln
-28.46%
jan 1, 2007
12.42 mln
-6.11 mln
-32.97%
jan 1, 2008
12.7 mln
+280.0K
2.25%
jan 1, 2009
35.38 mln
+22.68 mln
178.58%
jan 1, 2010
34.93 mln
-450.0K
-1.27%
jan 1, 2011
45.54 mln
+10.61 mln
30.38%
jan 1, 2012
57.57 mln
+12.03 mln
26.42%
jan 1, 2013
112.43 mln
+54.86 mln
95.29%
jan 1, 2014
86.51 mln
-25.92 mln
-23.05%
jan 1, 2015
11.72 mln
-74.79 mln
-86.45%
Ranking of countries by current statistics by years