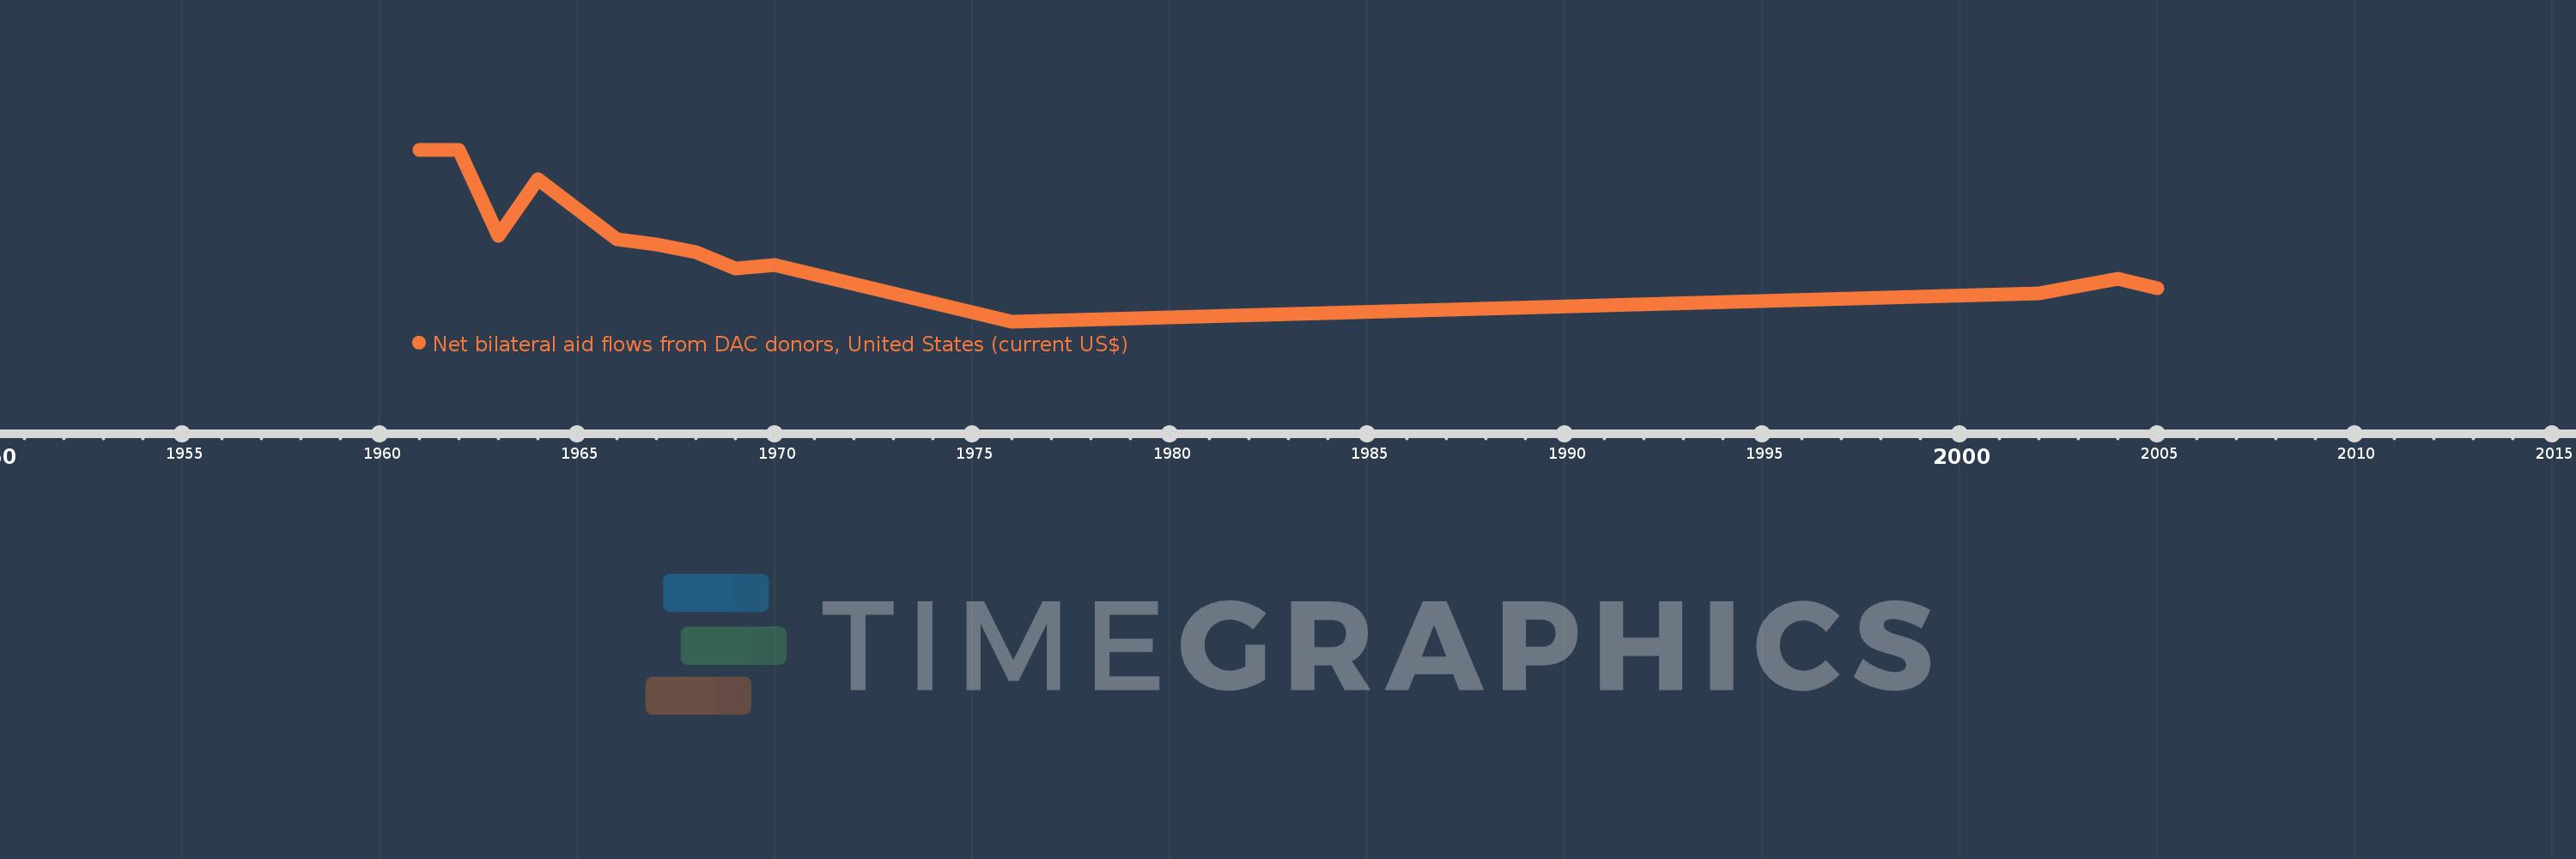
This timeline shows a graph from 1961 to 2005 of Hong Kong SAR, China. No data until 1960. Number of actual observations by date: 13.
Source name:
World Development Indicators
Source organization:
Development Assistance Committee of the Organisation for Economic Co-operation and Development, Geographical Distribution of Financial Flows to Developing Countries, Development Co-operation Report, and International Development Statistics database. Data are available online at: www.oecd.org/dac/stats/idsonline.
Categories, topics:
Aid Effectiveness
Last updated:
apr 23, 2017
Indicators value changes by year
Meaning:
1.739 mln
Minimum:
-1000.0K
jan 1, 1976
Maximum:
5.0 mln
jan 1, 1961
At the date of observation
Value
Absolute change
Change from the previous value
jan 1, 1961
5.0 mln
+5.0 mln
0.0%
jan 1, 1962
5.0 mln
0.0
0.0%
jan 1, 1963
2.0 mln
-3.0 mln
-60.0%
jan 1, 1964
4.0 mln
+2.0 mln
100.0%
jan 1, 1966
1.9 mln
-2.1 mln
-52.5%
jan 1, 1967
1.71 mln
-190.0K
-10.0%
jan 1, 1968
1.43 mln
-280.0K
-16.37%
jan 1, 1969
870.0K
-560.0K
-39.16%
jan 1, 1970
1000.0K
+130.0K
14.94%
jan 1, 1976
-1000.0K
-2.0 mln
-200.0%
jan 1, 2002
10.0K
+1.01 mln
-101.0%
jan 1, 2004
500.0K
+490.0K
4.9K%
jan 1, 2005
190.0K
-310.0K
-62.0%
Ranking of countries by current statistics by years