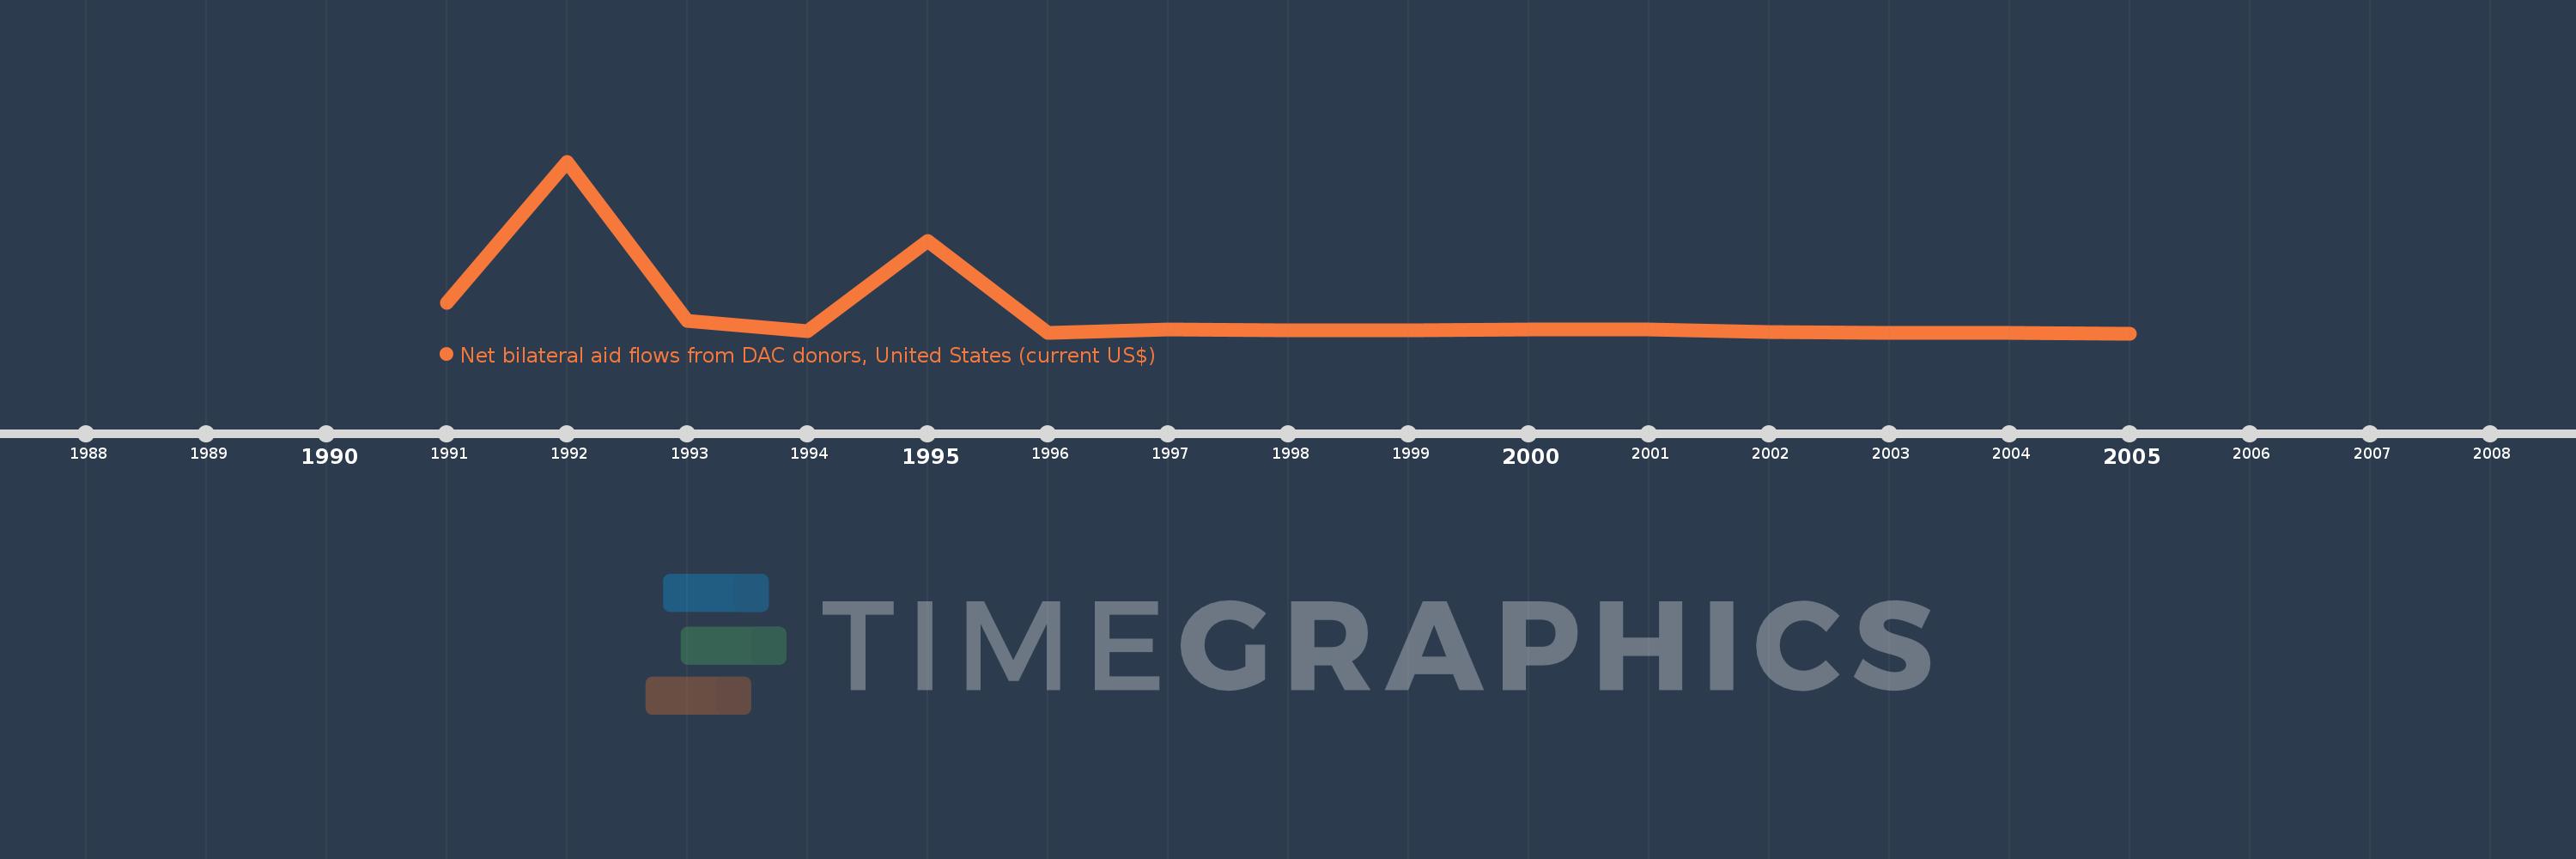
This timeline shows a graph from 1991 to 2005 of Poland. No data until 1990. Number of actual observations by date: 15.
Source name:
World Development Indicators
Source organization:
Development Assistance Committee of the Organisation for Economic Co-operation and Development, Geographical Distribution of Financial Flows to Developing Countries, Development Co-operation Report, and International Development Statistics database. Data are available online at: www.oecd.org/dac/stats/idsonline.
Categories, topics:
Aid Effectiveness
Last updated:
apr 23, 2017
Indicators value changes by year
Meaning:
198.785 mln
Minimum:
-820.0K
jan 1, 2005
Maximum:
1.563 bln
jan 1, 1992
At the date of observation
Value
Absolute change
Change from the previous value
jan 1, 1991
273.0 mln
+273.0 mln
0.0%
jan 1, 1992
1.563 bln
+1.29 bln
472.53%
jan 1, 1993
109.0 mln
-1.454 bln
-93.03%
jan 1, 1994
21.0 mln
-88.0 mln
-80.73%
jan 1, 1995
841.0 mln
+820.0 mln
3.9K%
jan 1, 1996
4.0 mln
-837.0 mln
-99.52%
jan 1, 1997
33.0 mln
+29.0 mln
725.0%
jan 1, 1998
26.0 mln
-7.0 mln
-21.21%
jan 1, 1999
30.23 mln
+4.23 mln
16.27%
jan 1, 2000
37.74 mln
+7.51 mln
24.84%
jan 1, 2001
32.67 mln
-5.07 mln
-13.43%
jan 1, 2002
7.97 mln
-24.7 mln
-75.6%
jan 1, 2003
3.12 mln
-4.85 mln
-60.85%
jan 1, 2004
860.0K
-2.26 mln
-72.44%
jan 1, 2005
-820.0K
-1.68 mln
-195.35%
Ranking of countries by current statistics by years