33
/
AIzaSyB4mHJ5NPEv-XzF7P6NDYXjlkCWaeKw5bc
November 30, 2025
180210
Libya
LBY
true
2
1
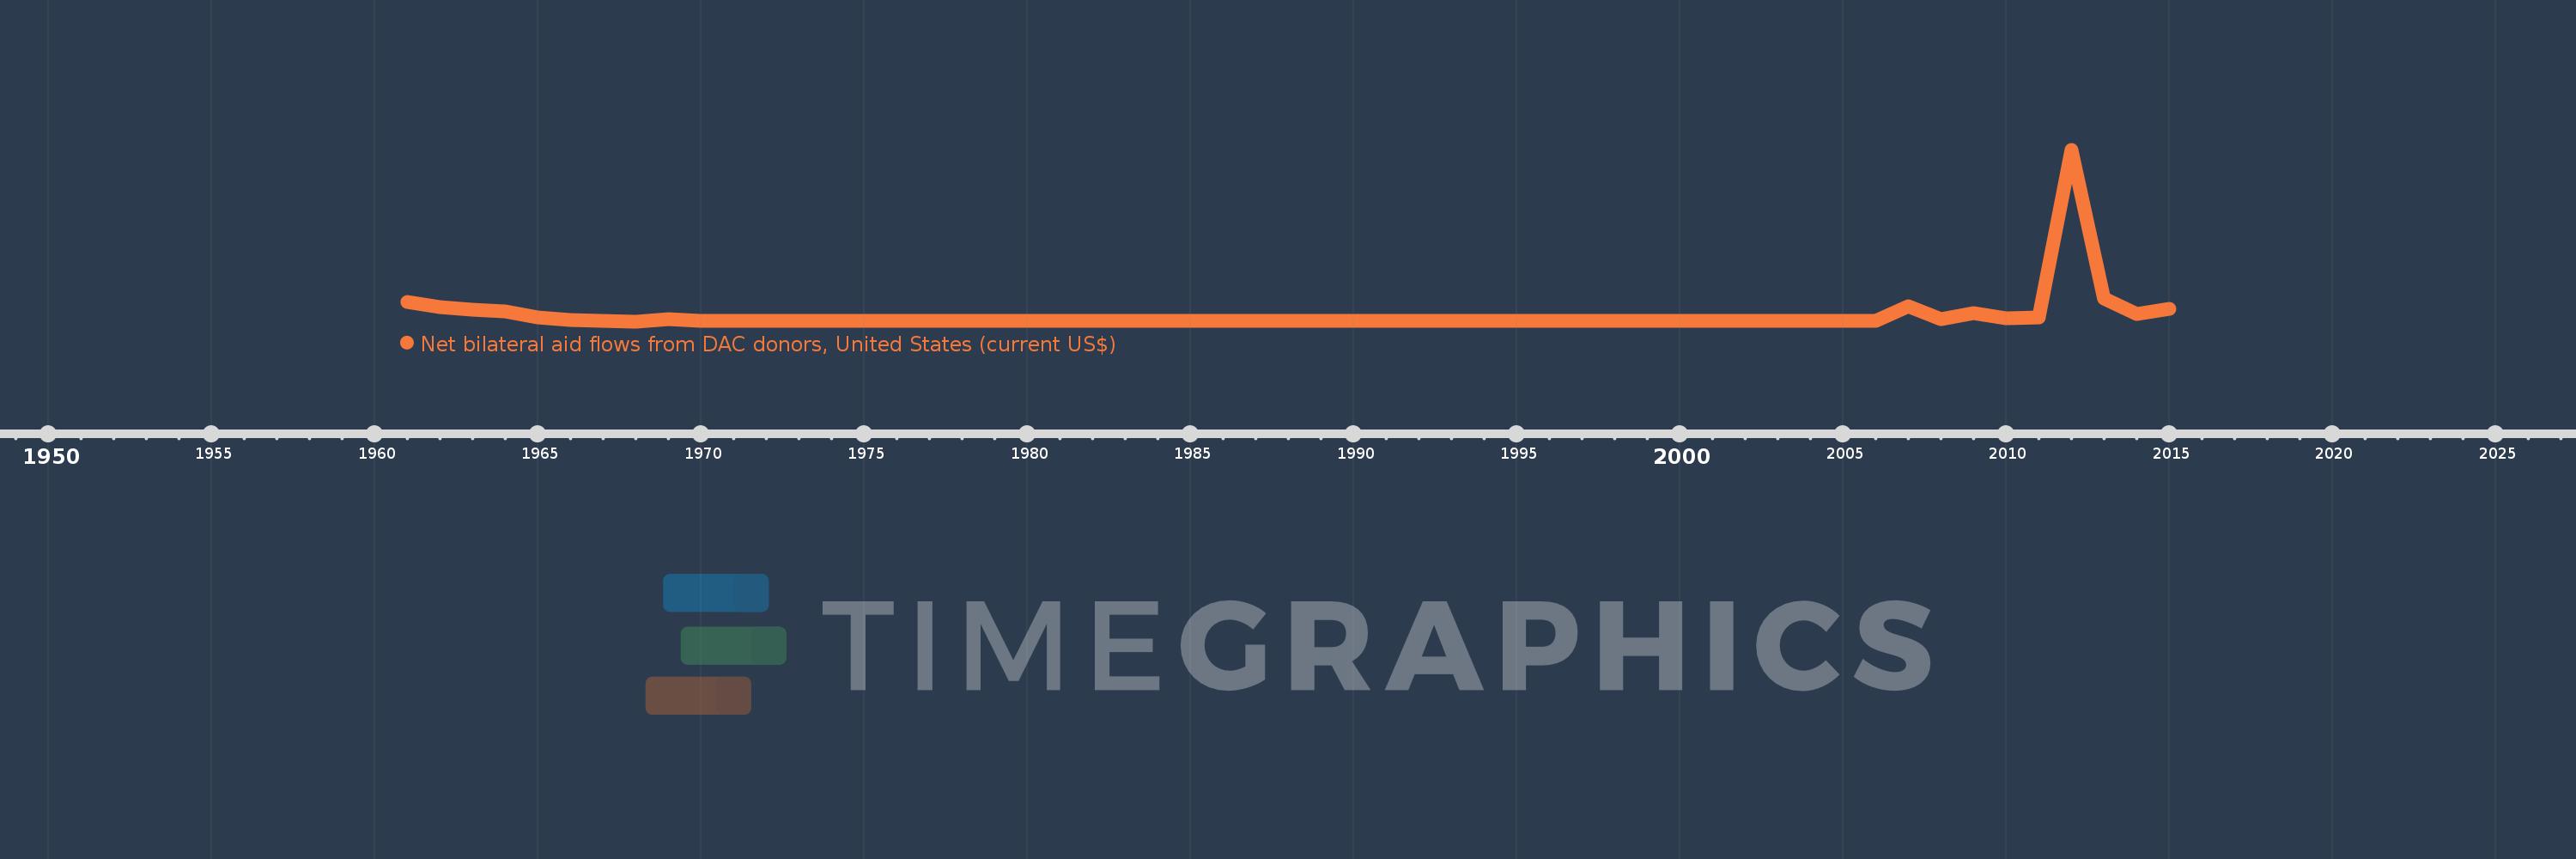
Net bilateral aid flows from DAC donors, United States (current US$)
2015,2014,2013,2012,2011,2010,2009,2008,2007,2006,2005,1970,1969,1968,1967,1966,1965,1964,1963,1962,1961