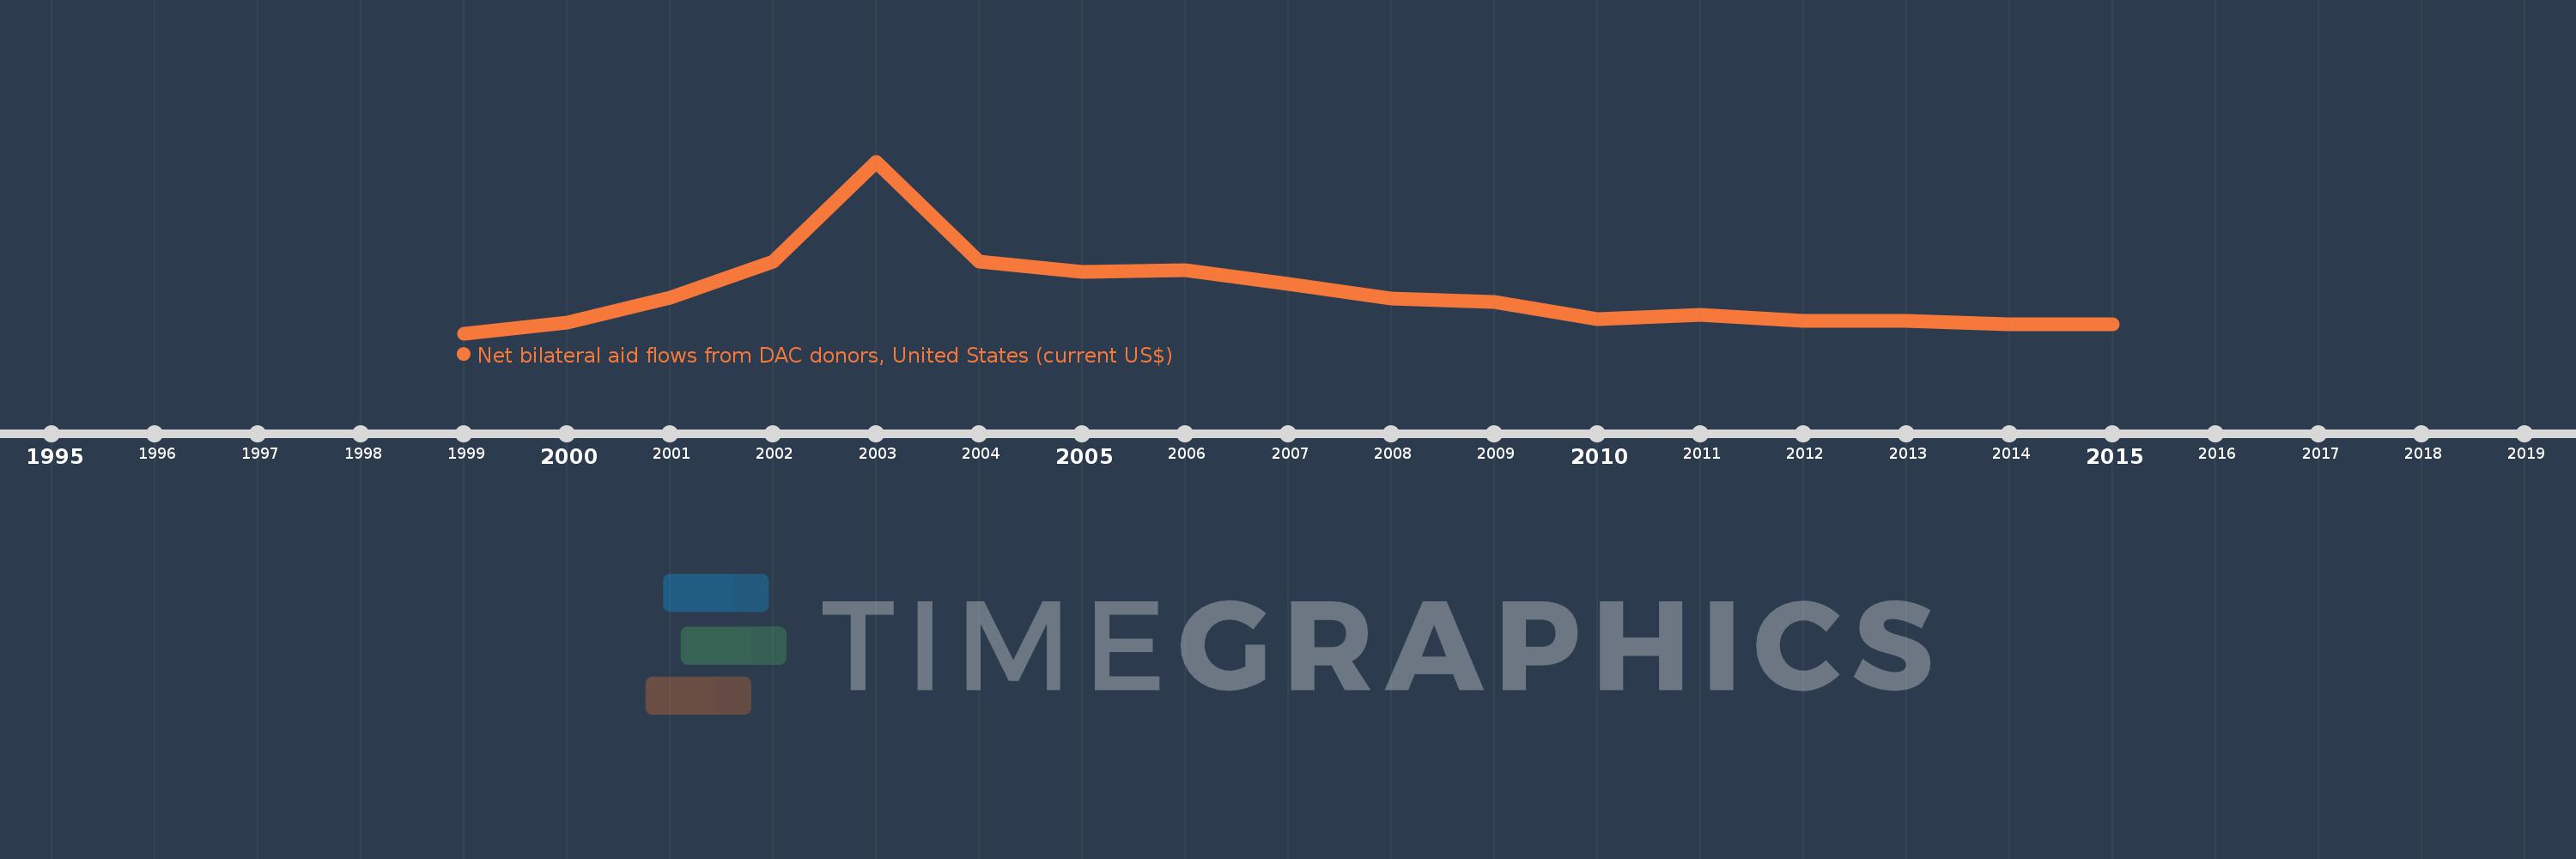
This timeline shows a graph from 1999 to 2015 of Serbia. No data until 1998. Number of actual observations by date: 17.
Source name:
World Development Indicators
Source organization:
Development Assistance Committee of the Organisation for Economic Co-operation and Development, Geographical Distribution of Financial Flows to Developing Countries, Development Co-operation Report, and International Development Statistics database. Data are available online at: www.oecd.org/dac/stats/idsonline.
Categories, topics:
Aid Effectiveness
Last updated:
apr 23, 2017
Indicators value changes by year
Meaning:
119.588 mln
Minimum:
6.36 mln
jan 1, 1999
Maximum:
495.37 mln
jan 1, 2003
At the date of observation
Value
Absolute change
Change from the previous value
jan 1, 1999
6.36 mln
+6.36 mln
0.0%
jan 1, 2000
36.87 mln
+30.51 mln
479.72%
jan 1, 2001
107.7 mln
+70.83 mln
192.11%
jan 1, 2002
210.22 mln
+102.52 mln
95.19%
jan 1, 2003
495.37 mln
+285.15 mln
135.64%
jan 1, 2004
209.71 mln
-285.66 mln
-57.67%
jan 1, 2005
181.23 mln
-28.48 mln
-13.58%
jan 1, 2006
185.71 mln
+4.48 mln
2.47%
jan 1, 2007
147.0 mln
-38.71 mln
-20.84%
jan 1, 2008
105.12 mln
-41.88 mln
-28.49%
jan 1, 2009
94.47 mln
-10.65 mln
-10.13%
jan 1, 2010
46.5 mln
-47.97 mln
-50.78%
jan 1, 2011
57.92 mln
+11.42 mln
24.56%
jan 1, 2012
42.16 mln
-15.76 mln
-27.21%
jan 1, 2013
41.51 mln
-650.0K
-1.54%
jan 1, 2014
32.29 mln
-9.22 mln
-22.21%
jan 1, 2015
32.86 mln
+570.0K
1.77%
Ranking of countries by current statistics by years