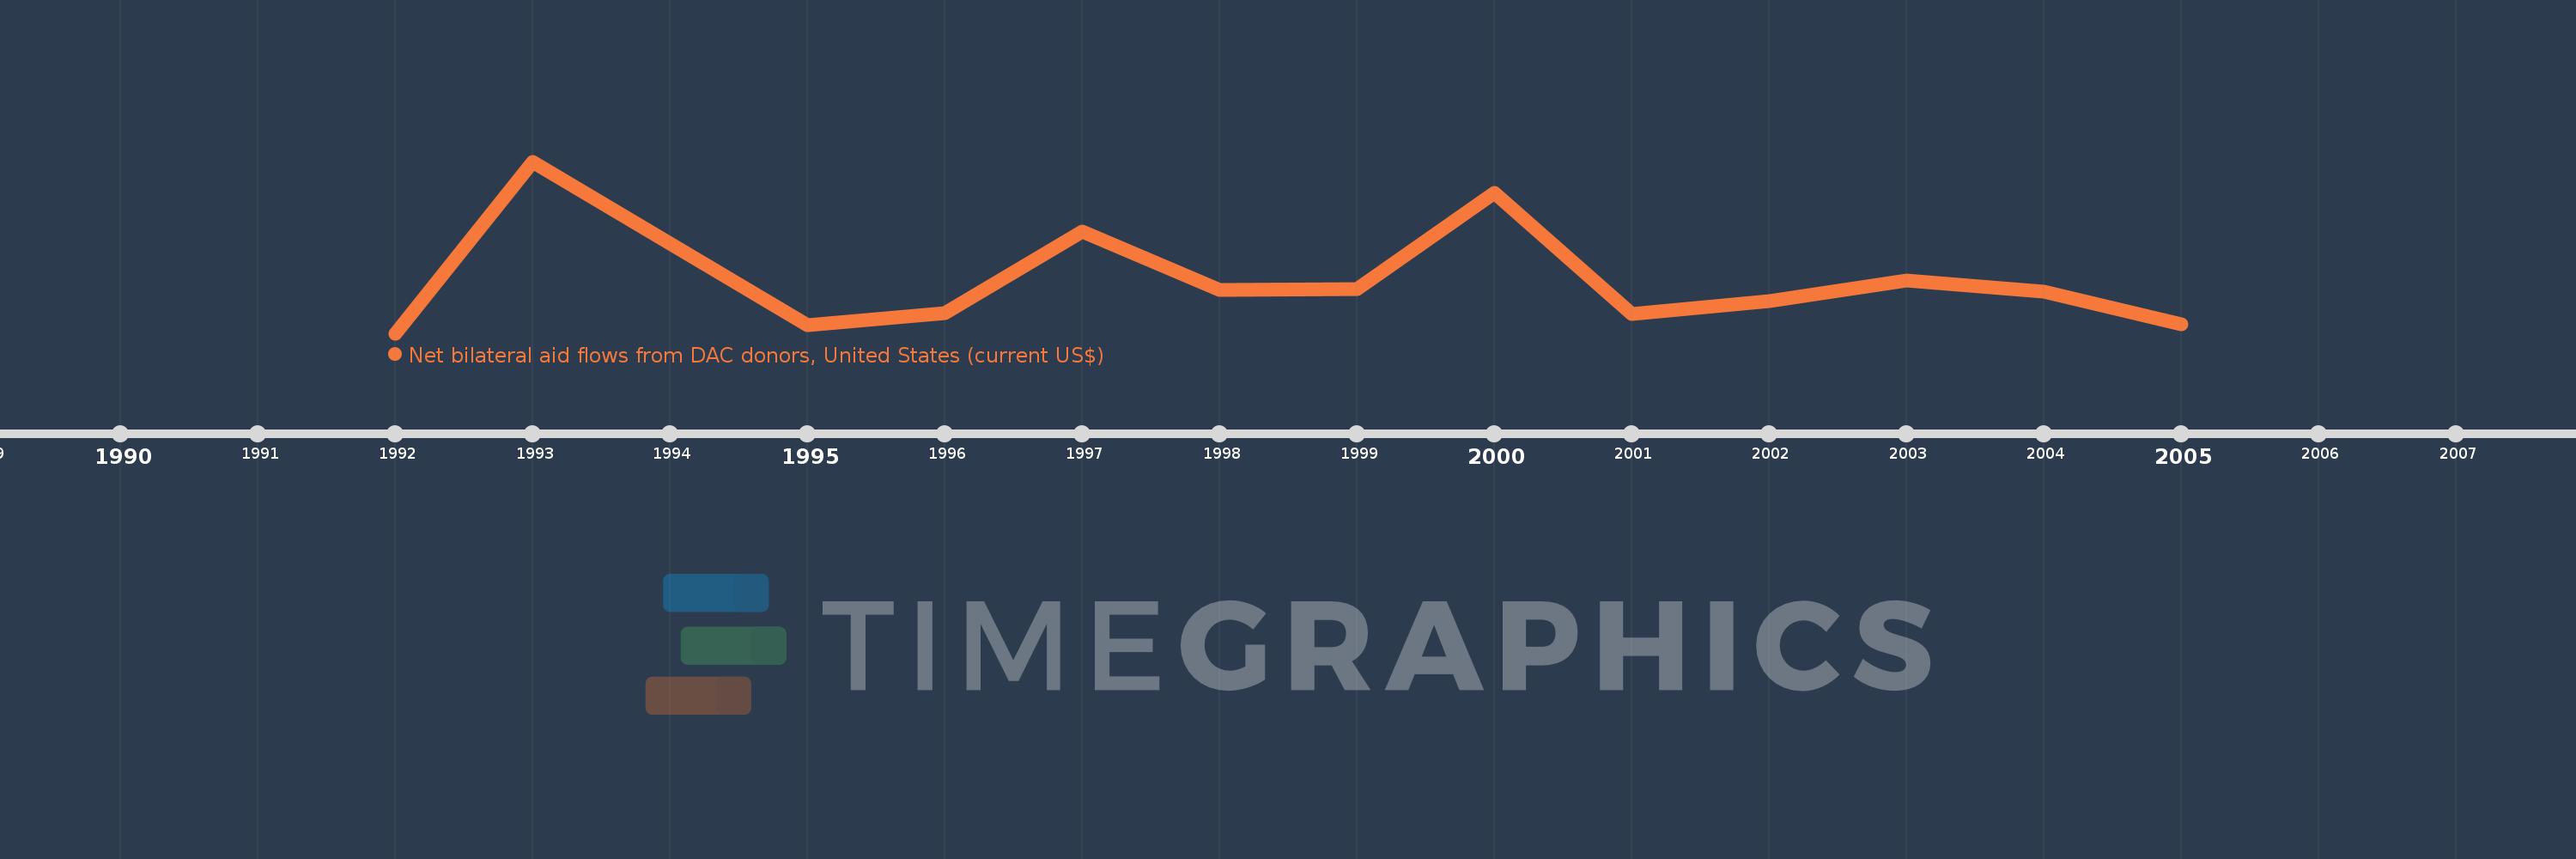
This timeline shows a graph from 1992 to 2005 of Slovak Republic. No data until 1991. Number of actual observations by date: 13.
Source name:
World Development Indicators
Source organization:
Development Assistance Committee of the Organisation for Economic Co-operation and Development, Geographical Distribution of Financial Flows to Developing Countries, Development Co-operation Report, and International Development Statistics database. Data are available online at: www.oecd.org/dac/stats/idsonline.
Categories, topics:
Aid Effectiveness
Last updated:
apr 23, 2017
Indicators value changes by year
Meaning:
4.813 mln
Minimum:
300.0K
jan 1, 1992
Maximum:
15.0 mln
jan 1, 1993
At the date of observation
Value
Absolute change
Change from the previous value
jan 1, 1992
300.0K
+300.0K
0.0%
jan 1, 1993
15.0 mln
+14.7 mln
4.9K%
jan 1, 1995
1000.0K
-14.0 mln
-93.33%
jan 1, 1996
2.0 mln
+1000.0K
100.0%
jan 1, 1997
9.0 mln
+7.0 mln
350.0%
jan 1, 1998
4.0 mln
-5.0 mln
-55.56%
jan 1, 1999
4.11 mln
+110.0K
2.75%
jan 1, 2000
12.3 mln
+8.19 mln
199.27%
jan 1, 2001
1.97 mln
-10.33 mln
-83.98%
jan 1, 2002
3.05 mln
+1.08 mln
54.82%
jan 1, 2003
4.85 mln
+1.8 mln
59.02%
jan 1, 2004
3.9 mln
-950.0K
-19.59%
jan 1, 2005
1.09 mln
-2.81 mln
-72.05%
Ranking of countries by current statistics by years