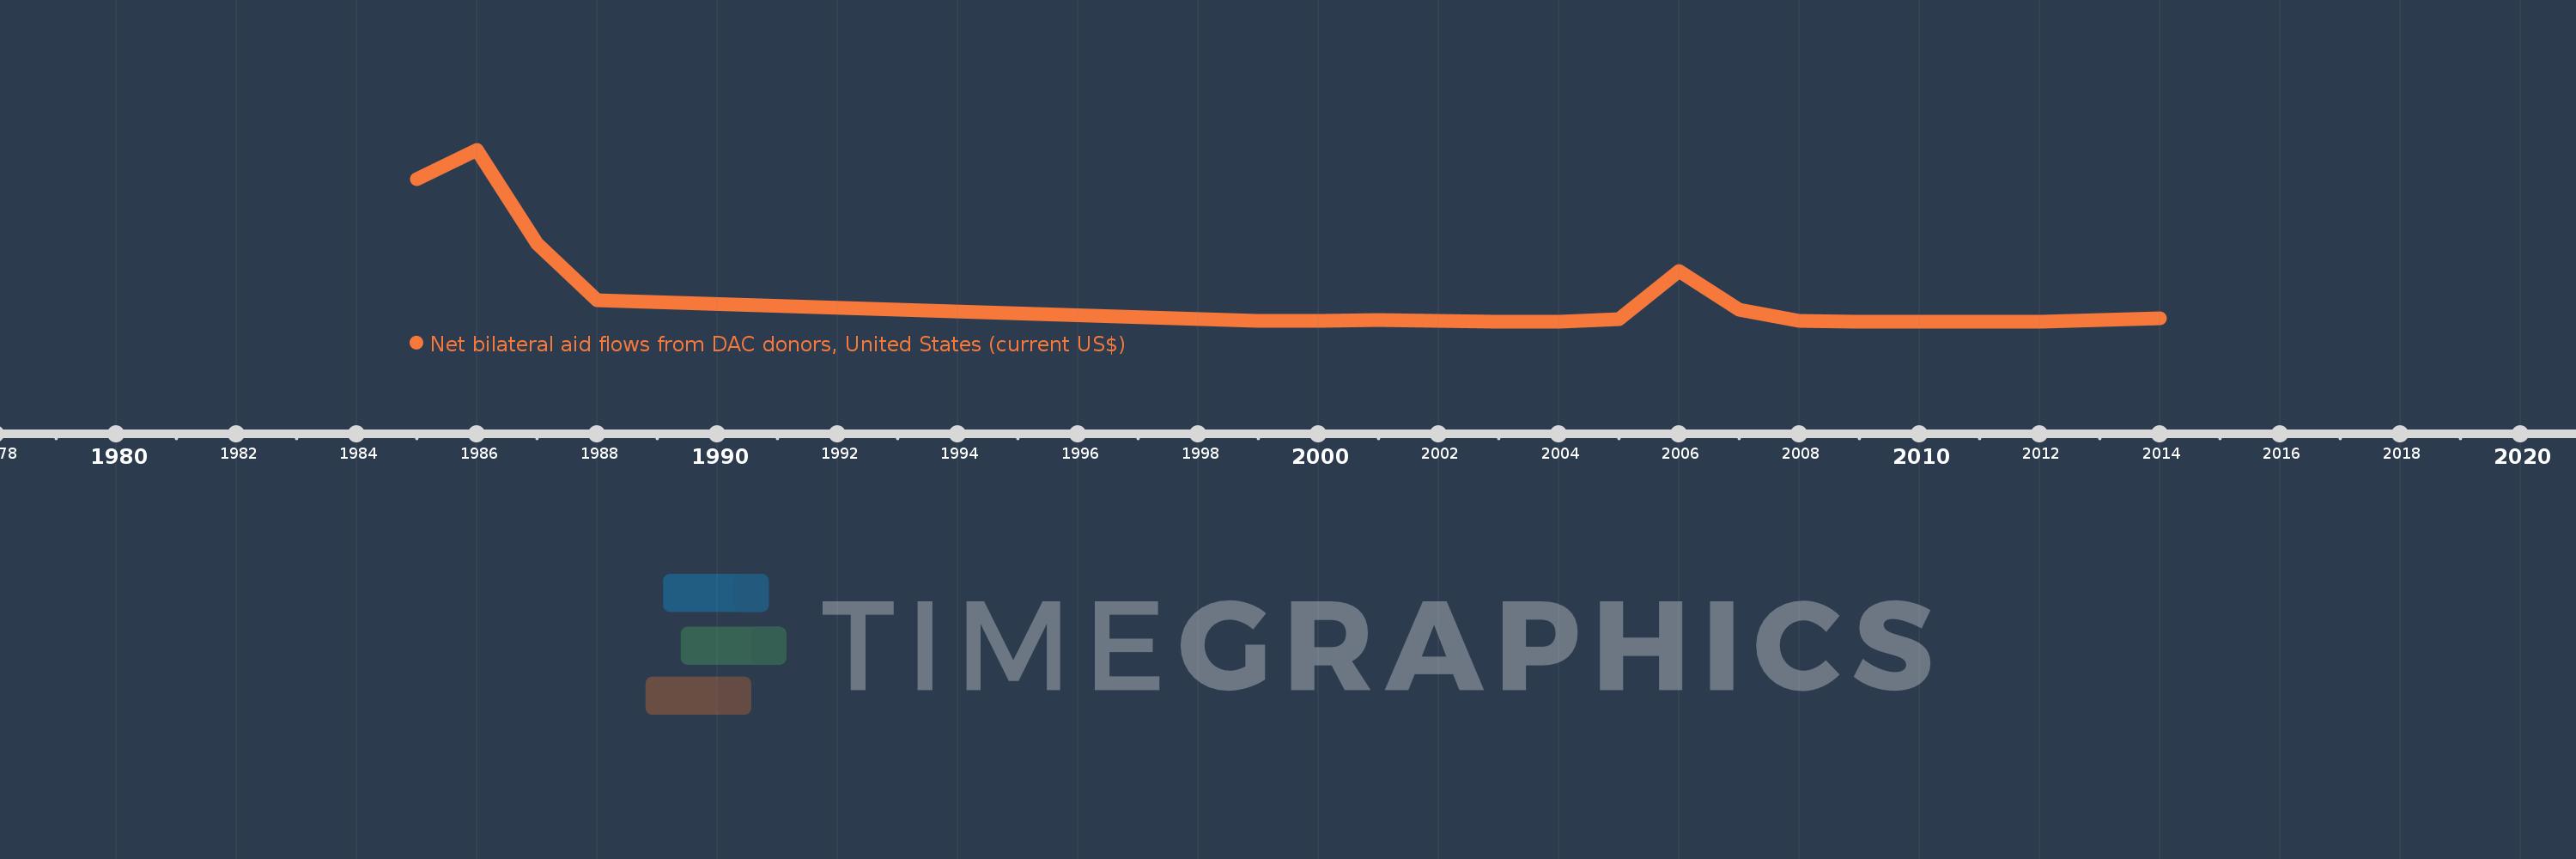
This timeline shows a graph from 1985 to 2014 of Grenada. No data until 1984. Number of actual observations by date: 19.
Source name:
World Development Indicators
Source organization:
Development Assistance Committee of the Organisation for Economic Co-operation and Development, Geographical Distribution of Financial Flows to Developing Countries, Development Co-operation Report, and International Development Statistics database. Data are available online at: www.oecd.org/dac/stats/idsonline.
Categories, topics:
Aid Effectiveness
Last updated:
apr 23, 2017
Indicators value changes by year
Meaning:
3.623 mln
Minimum:
10.0K
jan 1, 2004
Maximum:
24.0 mln
jan 1, 1986
At the date of observation
Value
Absolute change
Change from the previous value
jan 1, 1985
20.0 mln
+20.0 mln
0.0%
jan 1, 1986
24.0 mln
+4.0 mln
20.0%
jan 1, 1987
11.0 mln
-13.0 mln
-54.17%
jan 1, 1988
3.0 mln
-8.0 mln
-72.73%
jan 1, 1999
140.0K
-2.86 mln
-95.33%
jan 1, 2000
110.0K
-30.0K
-21.43%
jan 1, 2001
340.0K
+230.0K
209.09%
jan 1, 2002
190.0K
-150.0K
-44.12%
jan 1, 2003
20.0K
-170.0K
-89.47%
jan 1, 2004
10.0K
-10.0K
-50.0%
jan 1, 2005
370.0K
+360.0K
3.6K%
jan 1, 2006
7.11 mln
+6.74 mln
1.82K%
jan 1, 2007
1.75 mln
-5.36 mln
-75.39%
jan 1, 2008
130.0K
-1.62 mln
-92.57%
jan 1, 2009
50.0K
-80.0K
-61.54%
jan 1, 2010
80.0K
+30.0K
60.0%
jan 1, 2011
20.0K
-60.0K
-75.0%
jan 1, 2012
20.0K
0.0
0.0%
jan 1, 2014
500.0K
+480.0K
2.4K%
Ranking of countries by current statistics by years