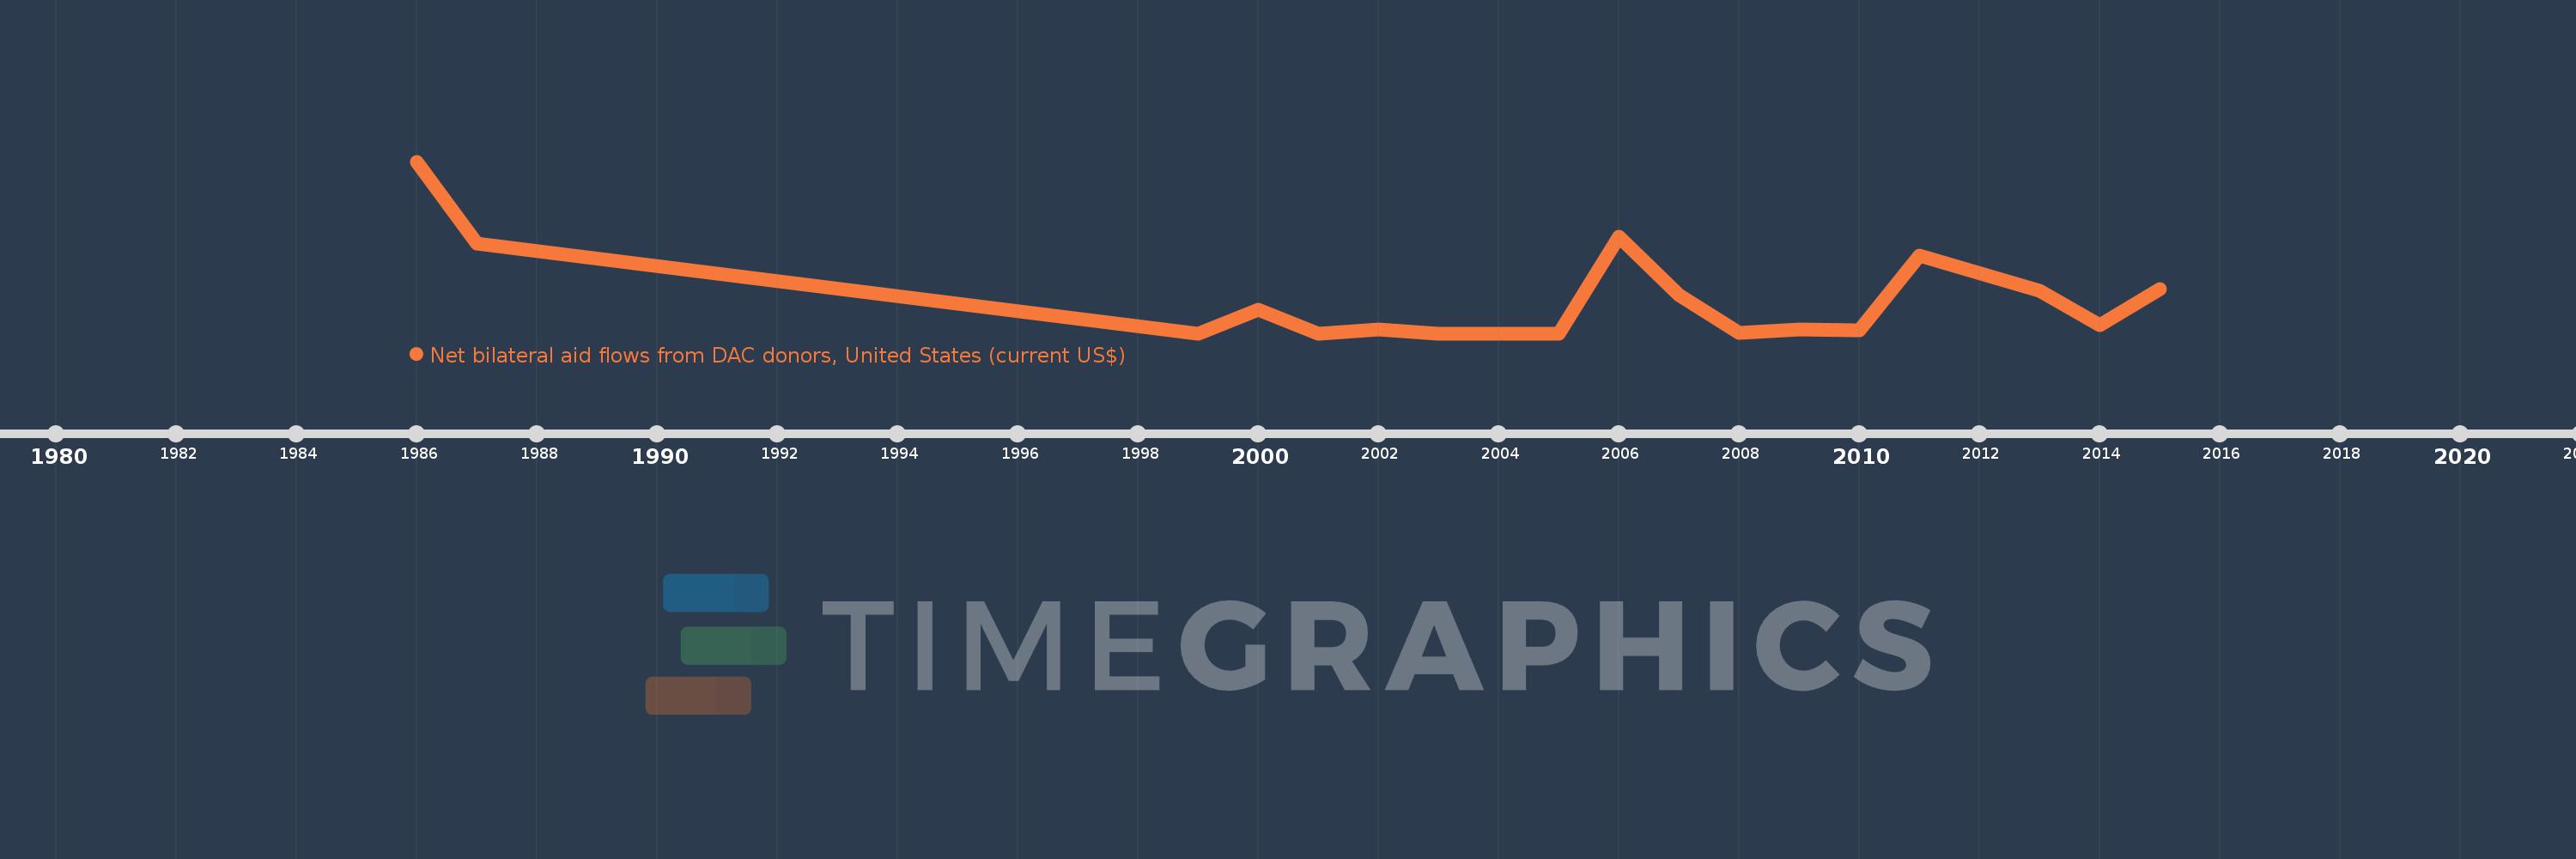
This timeline shows a graph from 1986 to 2015 of Maldives. No data until 1985. Number of actual observations by date: 18.
Source name:
World Development Indicators
Source organization:
Development Assistance Committee of the Organisation for Economic Co-operation and Development, Geographical Distribution of Financial Flows to Developing Countries, Development Co-operation Report, and International Development Statistics database. Data are available online at: www.oecd.org/dac/stats/idsonline.
Categories, topics:
Aid Effectiveness
Last updated:
apr 23, 2017
Indicators value changes by year
Meaning:
319.444K
Minimum:
-90.0K
jan 1, 1999
Maximum:
2.0 mln
jan 1, 1986
At the date of observation
Value
Absolute change
Change from the previous value
jan 1, 1986
2.0 mln
+2.0 mln
0.0%
jan 1, 1987
1000.0K
-1000.0K
-50.0%
jan 1, 1999
-90.0K
-1.09 mln
-109.0%
jan 1, 2000
200.0K
+290.0K
-322.22%
jan 1, 2001
-90.0K
-290.0K
-145.0%
jan 1, 2002
-40.0K
+50.0K
-55.56%
jan 1, 2003
-90.0K
-50.0K
125.0%
jan 1, 2004
-90.0K
0.0
0.0%
jan 1, 2005
-90.0K
0.0
0.0%
jan 1, 2006
1.09 mln
+1.18 mln
-1.31K%
jan 1, 2007
370.0K
-720.0K
-66.06%
jan 1, 2008
-80.0K
-450.0K
-121.62%
jan 1, 2009
-40.0K
+40.0K
-50.0%
jan 1, 2010
-50.0K
-10.0K
25.0%
jan 1, 2011
860.0K
+910.0K
-1.82K%
jan 1, 2013
430.0K
-430.0K
-50.0%
jan 1, 2014
10.0K
-420.0K
-97.67%
jan 1, 2015
450.0K
+440.0K
4.4K%
Ranking of countries by current statistics by years