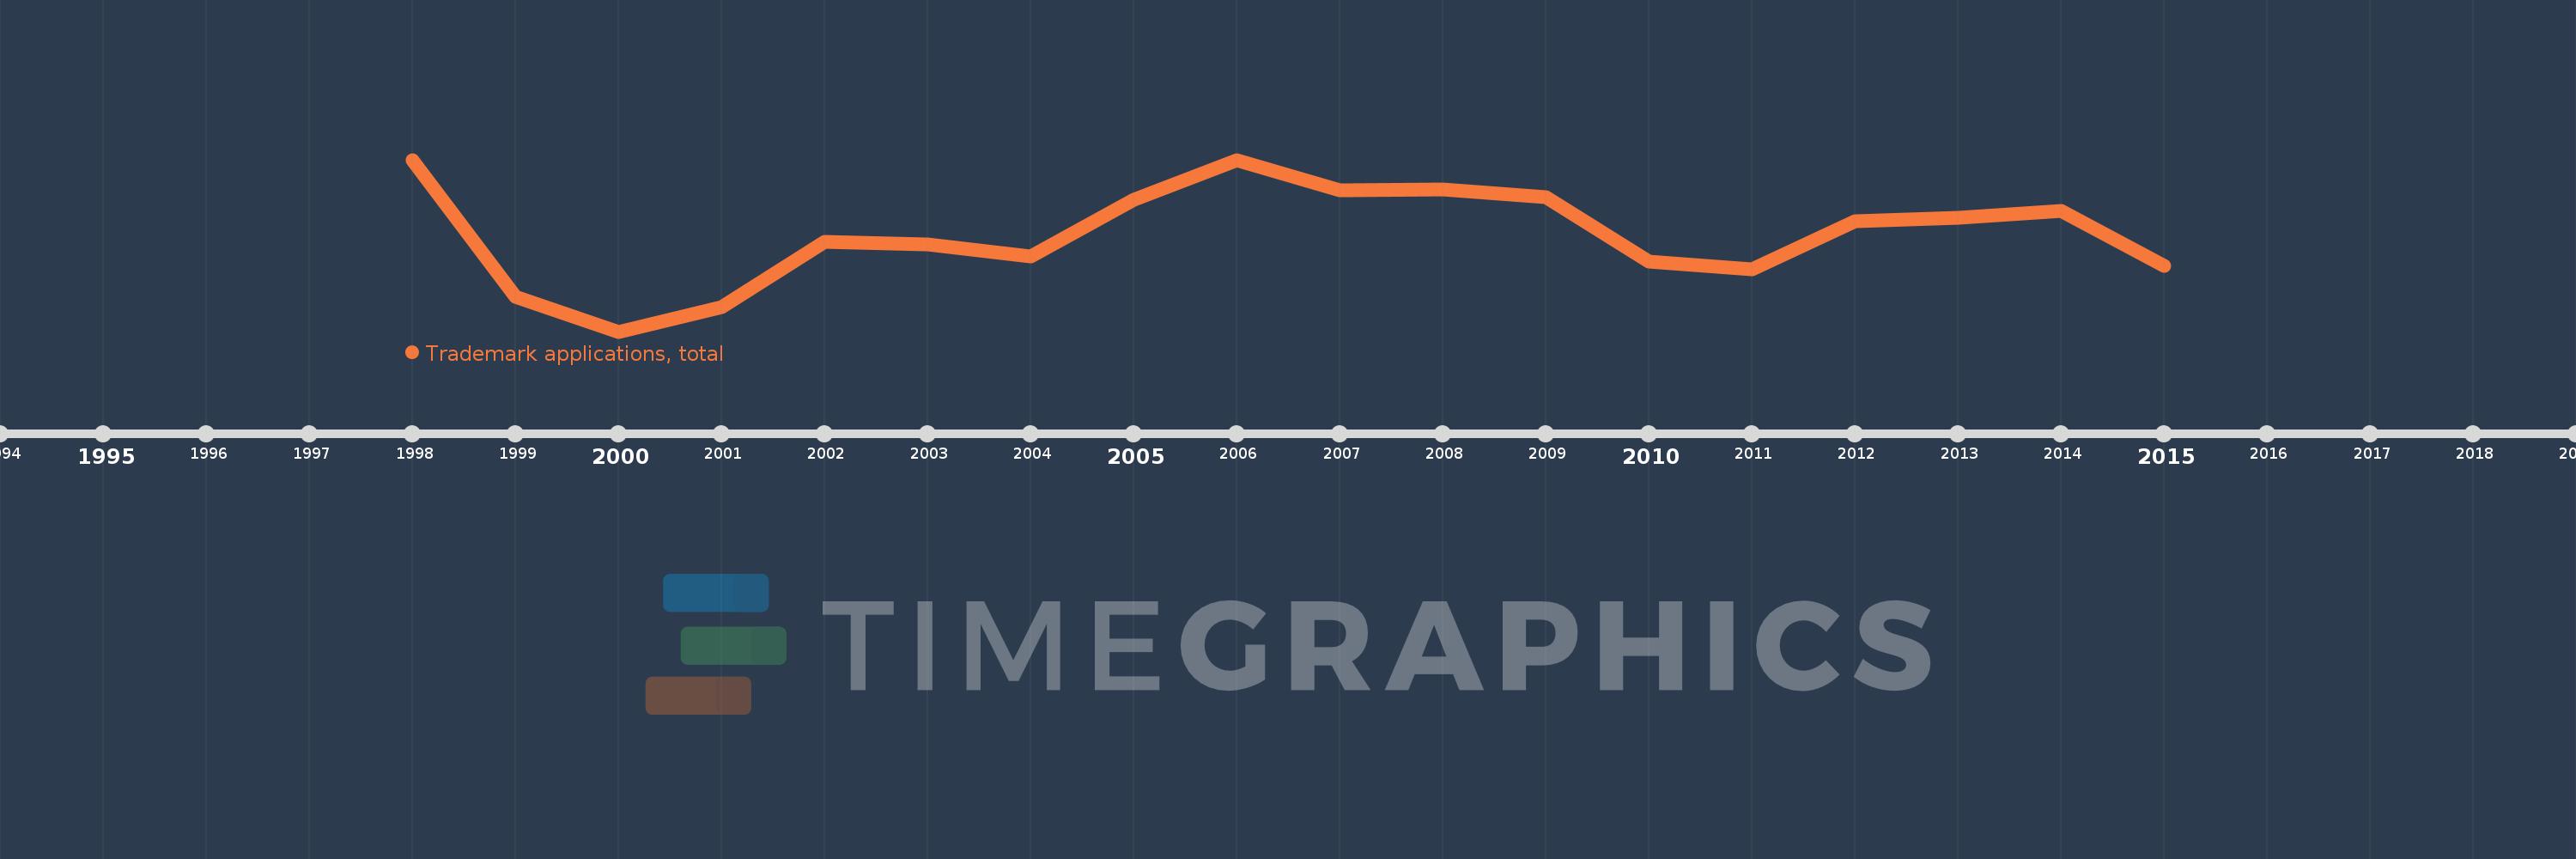
Questa scala temporale mostra un grafico dal 1998 anno al 2015 anno. Bhutan. I dati fino ad 1997 anno non disponibili. Il numero di osservazioni attuali secondo i date: 18.
La fonte (nome):
Indicatori dello sviluppo mondiale
La fonte (organizzazione):
World Intellectual Property Organization (WIPO), World Intellectual Property Indicators and www.wipo.int/econ_stat. The International Bureau of WIPO assumes no responsibility with respect to the transformation of these data.
Categorie:
Science & Technology
sono stati aggiornati
23 apr 2017 anni
Indicatori delle variazioni dei valori per anni
In media:
744.889
Minima:
223.0
1 gen 2000 anni
Massimo:
1.147 Mille.
1 gen 2006 anni
Alla data di osservazione
Valore
Variazione assoluta
La variazione rispetto al valore precedente
1 gen 1998 anni
1.143 Mille.
+1.143 Mille.
0.0%
1 gen 1999 anni
408.0
-735.0
-64.3%
1 gen 2000 anni
223.0
-185.0
-45.34%
1 gen 2001 anni
354.0
+131.0
58.74%
1 gen 2002 anni
707.0
+353.0
99.72%
1 gen 2003 anni
694.0
-13.0
-1.84%
1 gen 2004 anni
626.0
-68.0
-9.8%
1 gen 2005 anni
932.0
+306.0
48.88%
1 gen 2006 anni
1.147 Mille.
+215.0
23.07%
1 gen 2007 anni
983.0
-164.0
-14.3%
1 gen 2008 anni
986.0
+3.0
0.31%
1 gen 2009 anni
946.0
-40.0
-4.06%
1 gen 2010 anni
599.0
-347.0
-36.68%
1 gen 2011 anni
559.0
-40.0
-6.68%
1 gen 2012 anni
818.0
+259.0
46.33%
1 gen 2013 anni
835.0
+17.0
2.08%
1 gen 2014 anni
870.0
+35.0
4.19%
1 gen 2015 anni
578.0
-292.0
-33.56%
Classificazione dei paesi secondo i statistiche attuali per anni