33
/it/
AIzaSyAYiBZKx7MnpbEhh9jyipgxe19OcubqV5w
August 1, 2025
261721
Tanzania
TZA
true
2
1
Trademark applications, total
2008,2007,2006,2005,2004,2003,2002,2001,2000,1999,1990,1989,1983,1981,1980,1978,1977,1975,1973,1968,1966,1965,1964,1963,1962
Download
Biblioteca di statistiche globali →Tanzania →

Trademark applications, total

Queste statistiche in altri paesi:

AlbaniaAlgeriaAndorraAngolaAntigua and BarbudaArab WorldArgentinaArmeniaArubaAustraliaAustriaAzerbaijanBahamas, TheBahrainBangladeshBarbadosBelarusBelgiumBelizeBhutanBoliviaBosnia and HerzegovinaBotswanaBrazilBrunei DarussalamBulgariaBurkina FasoBurundiCabo VerdeCambodiaCanadaCaribbean small statesCentral Europe and the BalticsChileChinaColombiaComorosCongo, Dem. Rep.Costa RicaCroatiaCubaCuracaoCyprusCzech RepublicDenmarkDjiboutiDominicaDominican RepublicEarly-demographic dividendEast Asia & PacificEast Asia & Pacific (excluding high income)East Asia & Pacific (IDA & IBRD countries)EcuadorEgypt, Arab Rep.El SalvadorEquatorial GuineaEstoniaEthiopiaEuro areaEurope & Central AsiaEurope & Central Asia (excluding high income)Europe & Central Asia (IDA & IBRD countries)European UnionFijiFinlandFranceGambia, TheGeorgiaGermanyGhanaGreeceGrenadaGuatemalaGuineaGuinea-BissauGuyanaHaitiHigh incomeHondurasHong Kong SAR, ChinaHungaryIBRD onlyIcelandIDA & IBRD totalIDA blendIDA onlyIDA totalIndiaIndonesiaIran, Islamic Rep.IraqIrelandIsraelItalyJamaicaJapanJordanKazakhstanKenyaKiribatiKorea, Dem. People’s Rep.Korea, Rep.KuwaitKyrgyz RepublicLao PDRLate-demographic dividendLatin America & Caribbean Latin America & Caribbean (excluding high income)Latin America & the Caribbean (IDA & IBRD countries)LatviaLeast developed countries: UN classificationLebanonLesothoLiberiaLibyaLiechtensteinLithuaniaLow & middle incomeLower middle incomeLuxembourgMacao SAR, ChinaMacedonia, FYRMadagascarMalawiMalaysiaMaldivesMaliMaltaMauritiusMexicoMiddle East & North AfricaMiddle East & North Africa (excluding high income)Middle East & North Africa (IDA & IBRD countries)Middle incomeMoldovaMonacoMongoliaMontenegroMoroccoMozambiqueMyanmarNamibiaNepalNetherlandsNew ZealandNicaraguaNigeriaNorth AmericaNorwayOECD membersOmanOther small statesPacific island small statesPakistanPanamaPapua New GuineaParaguayPeruPhilippinesPolandPortugalPost-demographic dividendQatarRomaniaRussian FederationRwandaSamoaSan MarinoSao Tome and PrincipeSaudi ArabiaSerbiaSeychellesSierra LeoneSingaporeSint Maarten (Dutch part)Slovak RepublicSloveniaSmall statesSolomon IslandsSomaliaSouth AfricaSouth AsiaSouth Asia (IDA & IBRD)SpainSri LankaSt. LuciaSt. Vincent and the GrenadinesSudanSurinameSwazilandSwedenSwitzerlandSyrian Arab RepublicTajikistanTanzaniaThailandTongaTrinidad and TobagoTunisiaTurkeyTurkmenistanTuvaluUgandaUkraineUnited Arab EmiratesUnited KingdomUnited StatesUpper middle incomeUruguayUzbekistanVenezuela, RBVietnamWorldYemen, Rep.ZambiaZimbabwe

Linea del tempo:

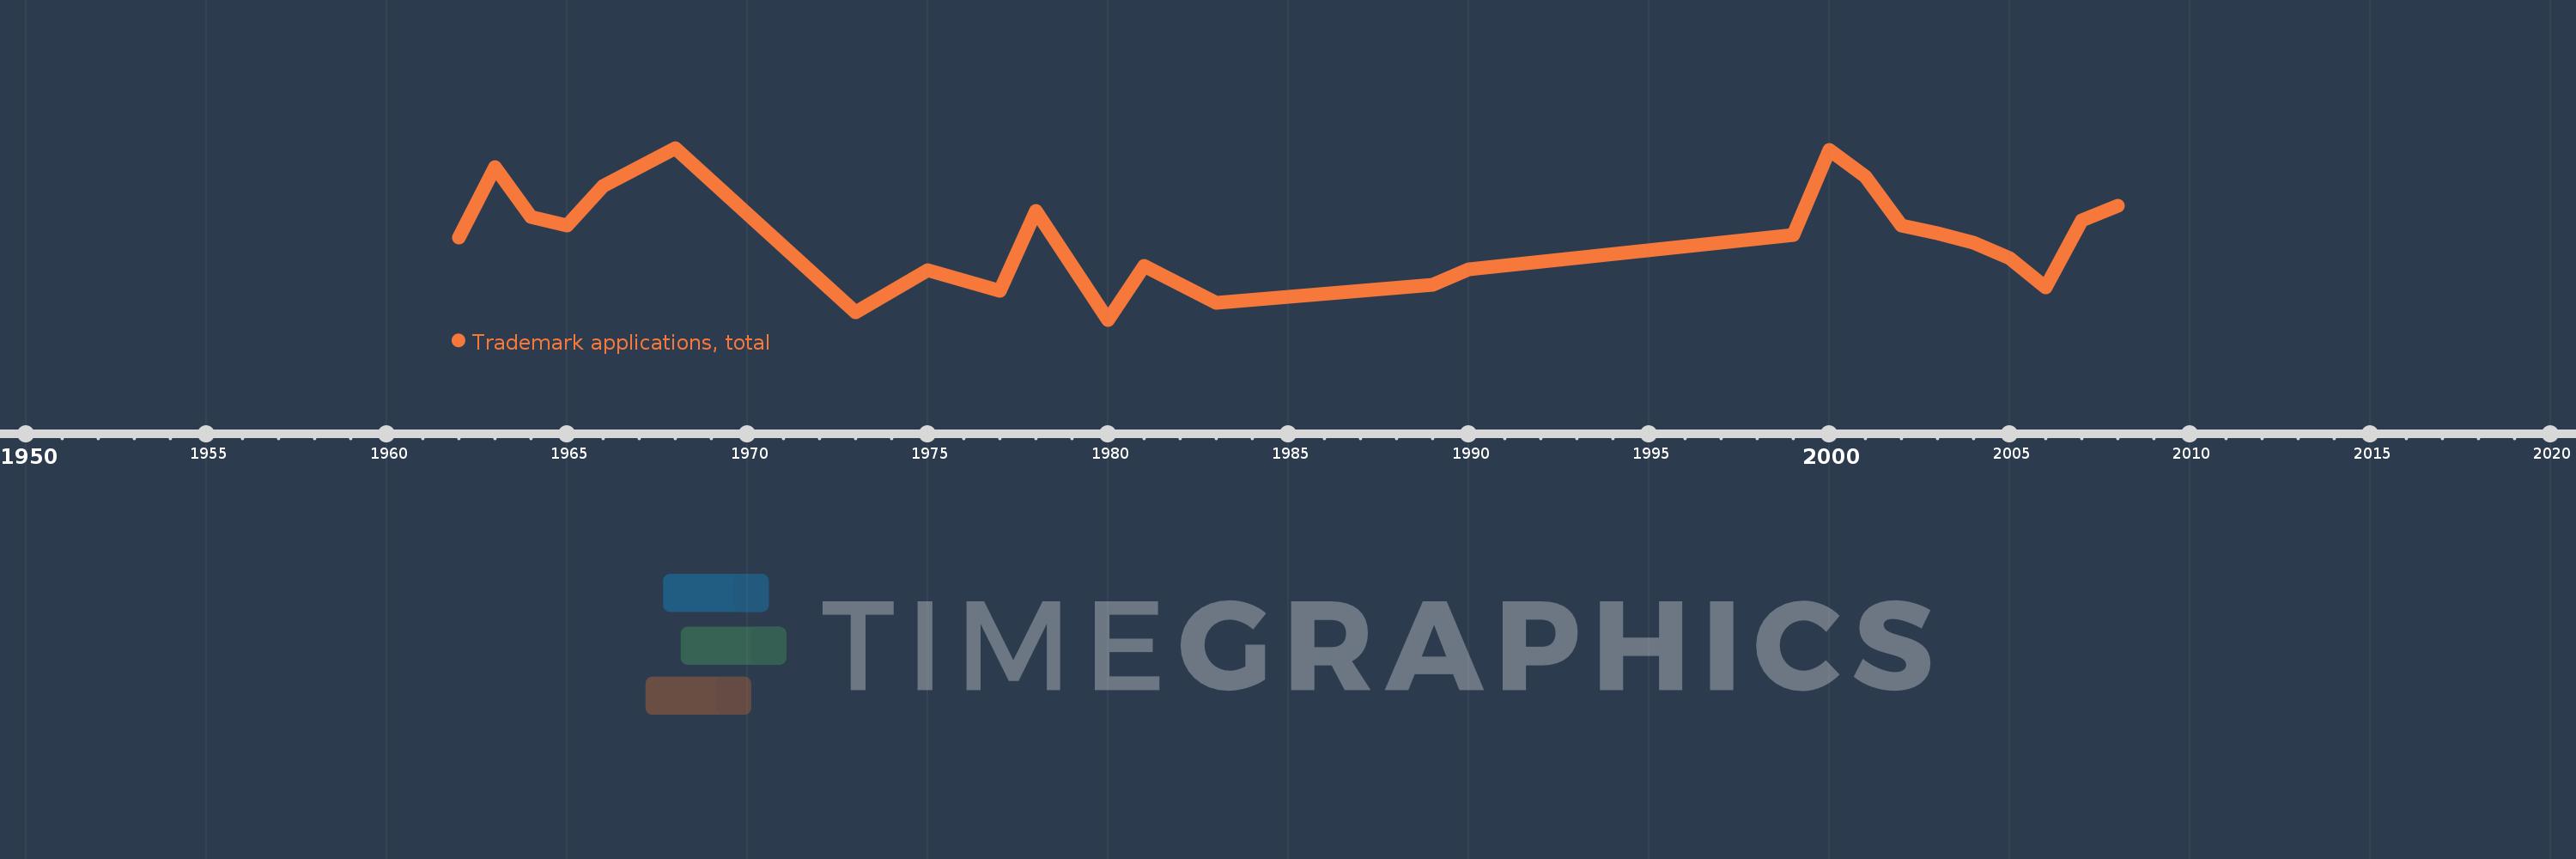
Questa scala temporale mostra un grafico dal 1962 anno al 2008 anno. Tanzania. I dati fino ad 1961 anno non disponibili. Il numero di osservazioni attuali secondo i date: 25.

La fonte (nome):

Indicatori dello sviluppo mondiale

La fonte (organizzazione):

World Intellectual Property Organization (WIPO), World Intellectual Property Indicators and www.wipo.int/econ_stat. The International Bureau of WIPO assumes no responsibility with respect to the transformation of these data.

Categorie:

Science & Technology

sono stati aggiornati

23 apr 2017 anni

Indicatori delle variazioni dei valori per anni

In media:
466.24
Minima:
234.0
1 gen 1980 anni
Massimo:
721.0
1 gen 1968 anni
Alla data di osservazione
Valore
Variazione assoluta
La variazione rispetto al valore precedente
1 gen 1962 anni
466.0
+466.0
0.0%
1 gen 1963 anni
667.0
+201.0
43.13%
1 gen 1964 anni
526.0
-141.0
-21.14%
1 gen 1965 anni
501.0
-25.0
-4.75%
1 gen 1966 anni
613.0
+112.0
22.36%
1 gen 1968 anni
721.0
+108.0
17.62%
1 gen 1973 anni
254.0
-467.0
-64.77%
1 gen 1975 anni
374.0
+120.0
47.24%
1 gen 1977 anni
315.0
-59.0
-15.78%
1 gen 1978 anni
542.0
+227.0
72.06%
1 gen 1980 anni
234.0
-308.0
-56.83%
1 gen 1981 anni
386.0
+152.0
64.96%
1 gen 1983 anni
281.0
-105.0
-27.2%
1 gen 1989 anni
332.0
+51.0
18.15%
1 gen 1990 anni
377.0
+45.0
13.55%
1 gen 1999 anni
474.0
+97.0
25.73%
1 gen 2000 anni
715.0
+241.0
50.84%
1 gen 2001 anni
641.0
-74.0
-10.35%
1 gen 2002 anni
502.0
-139.0
-21.68%
1 gen 2003 anni
478.0
-24.0
-4.78%
1 gen 2004 anni
452.0
-26.0
-5.44%
1 gen 2005 anni
408.0
-44.0
-9.73%
1 gen 2006 anni
325.0
-83.0
-20.34%
1 gen 2007 anni
516.0
+191.0
58.77%
1 gen 2008 anni
556.0
+40.0
7.75%

Classificazione dei paesi secondo i statistiche attuali per anni