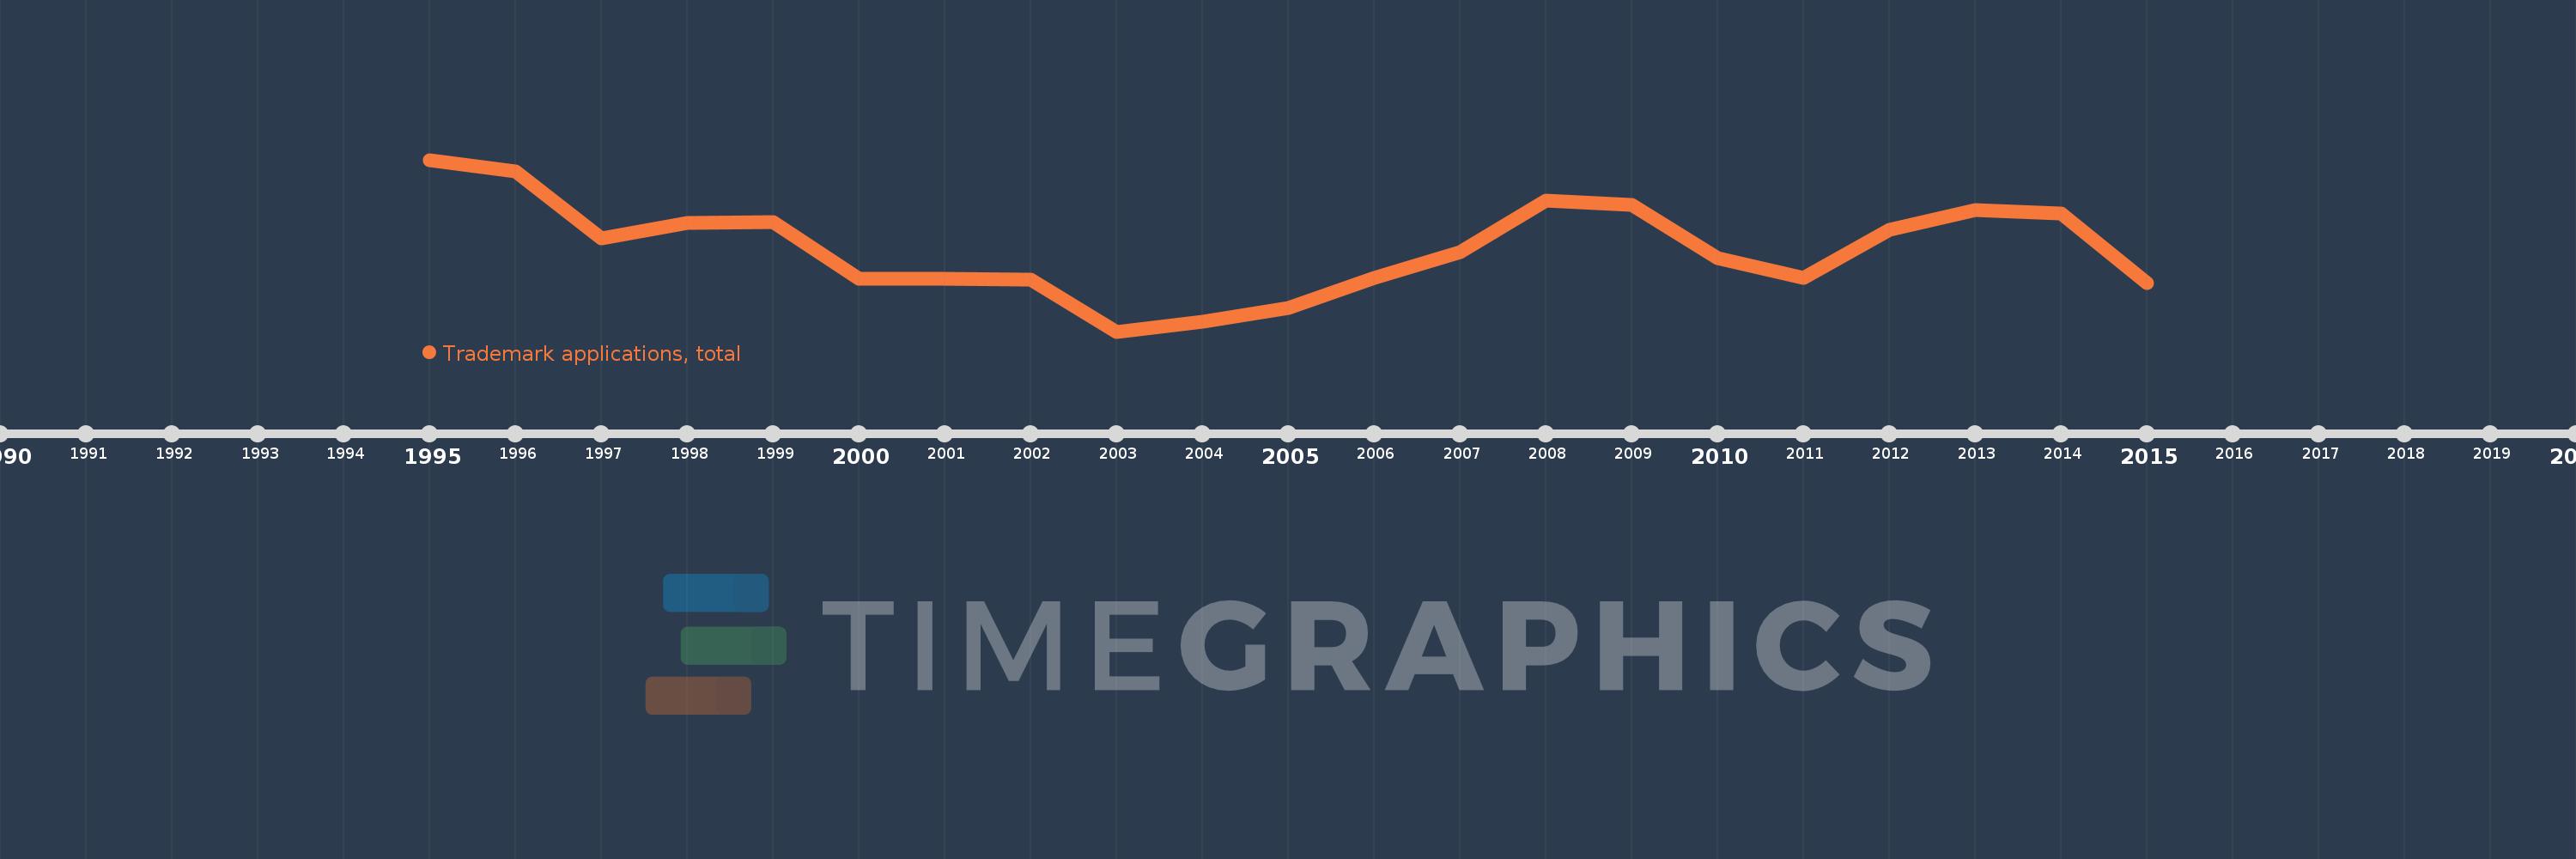
Questa scala temporale mostra un grafico dal 1995 anno al 2015 anno. Tajikistan. I dati fino ad 1994 anno non disponibili. Il numero di osservazioni attuali secondo i date: 21.
La fonte (nome):
Indicatori dello sviluppo mondiale
La fonte (organizzazione):
World Intellectual Property Organization (WIPO), World Intellectual Property Indicators and www.wipo.int/econ_stat. The International Bureau of WIPO assumes no responsibility with respect to the transformation of these data.
Categorie:
Science & Technology
sono stati aggiornati
23 apr 2017 anni
Indicatori delle variazioni dei valori per anni
In media:
2.594 Mille.
Minima:
1.741 Mille.
1 gen 2003 anni
Massimo:
3.509 Mille.
1 gen 1995 anni
Alla data di osservazione
Valore
Variazione assoluta
La variazione rispetto al valore precedente
1 gen 1995 anni
3.509 Mille.
+3.509 Mille.
0.0%
1 gen 1996 anni
3.386 Mille.
-123.0
-3.51%
1 gen 1997 anni
2.702 Mille.
-684.0
-20.2%
1 gen 1998 anni
2.857 Mille.
+155.0
5.74%
1 gen 1999 anni
2.871 Mille.
+14.0
0.49%
1 gen 2000 anni
2.282 Mille.
-589.0
-20.52%
1 gen 2001 anni
2.283 Mille.
+1.0
0.04%
1 gen 2002 anni
2.276 Mille.
-7.0
-0.31%
1 gen 2003 anni
1.741 Mille.
-535.0
-23.51%
1 gen 2004 anni
1.842 Mille.
+101.0
5.8%
1 gen 2005 anni
1.985 Mille.
+143.0
7.76%
1 gen 2006 anni
2.291 Mille.
+306.0
15.42%
1 gen 2007 anni
2.56 Mille.
+269.0
11.74%
1 gen 2008 anni
3.088 Mille.
+528.0
20.63%
1 gen 2009 anni
3.044 Mille.
-44.0
-1.42%
1 gen 2010 anni
2.496 Mille.
-548.0
-18.0%
1 gen 2011 anni
2.293 Mille.
-203.0
-8.13%
1 gen 2012 anni
2.788 Mille.
+495.0
21.59%
1 gen 2013 anni
2.992 Mille.
+204.0
7.32%
1 gen 2014 anni
2.956 Mille.
-36.0
-1.2%
1 gen 2015 anni
2.241 Mille.
-715.0
-24.19%
Classificazione dei paesi secondo i statistiche attuali per anni