33
/it/
AIzaSyB4mHJ5NPEv-XzF7P6NDYXjlkCWaeKw5bc
November 30, 2025
141225
Ghana
GHA
true
2
1
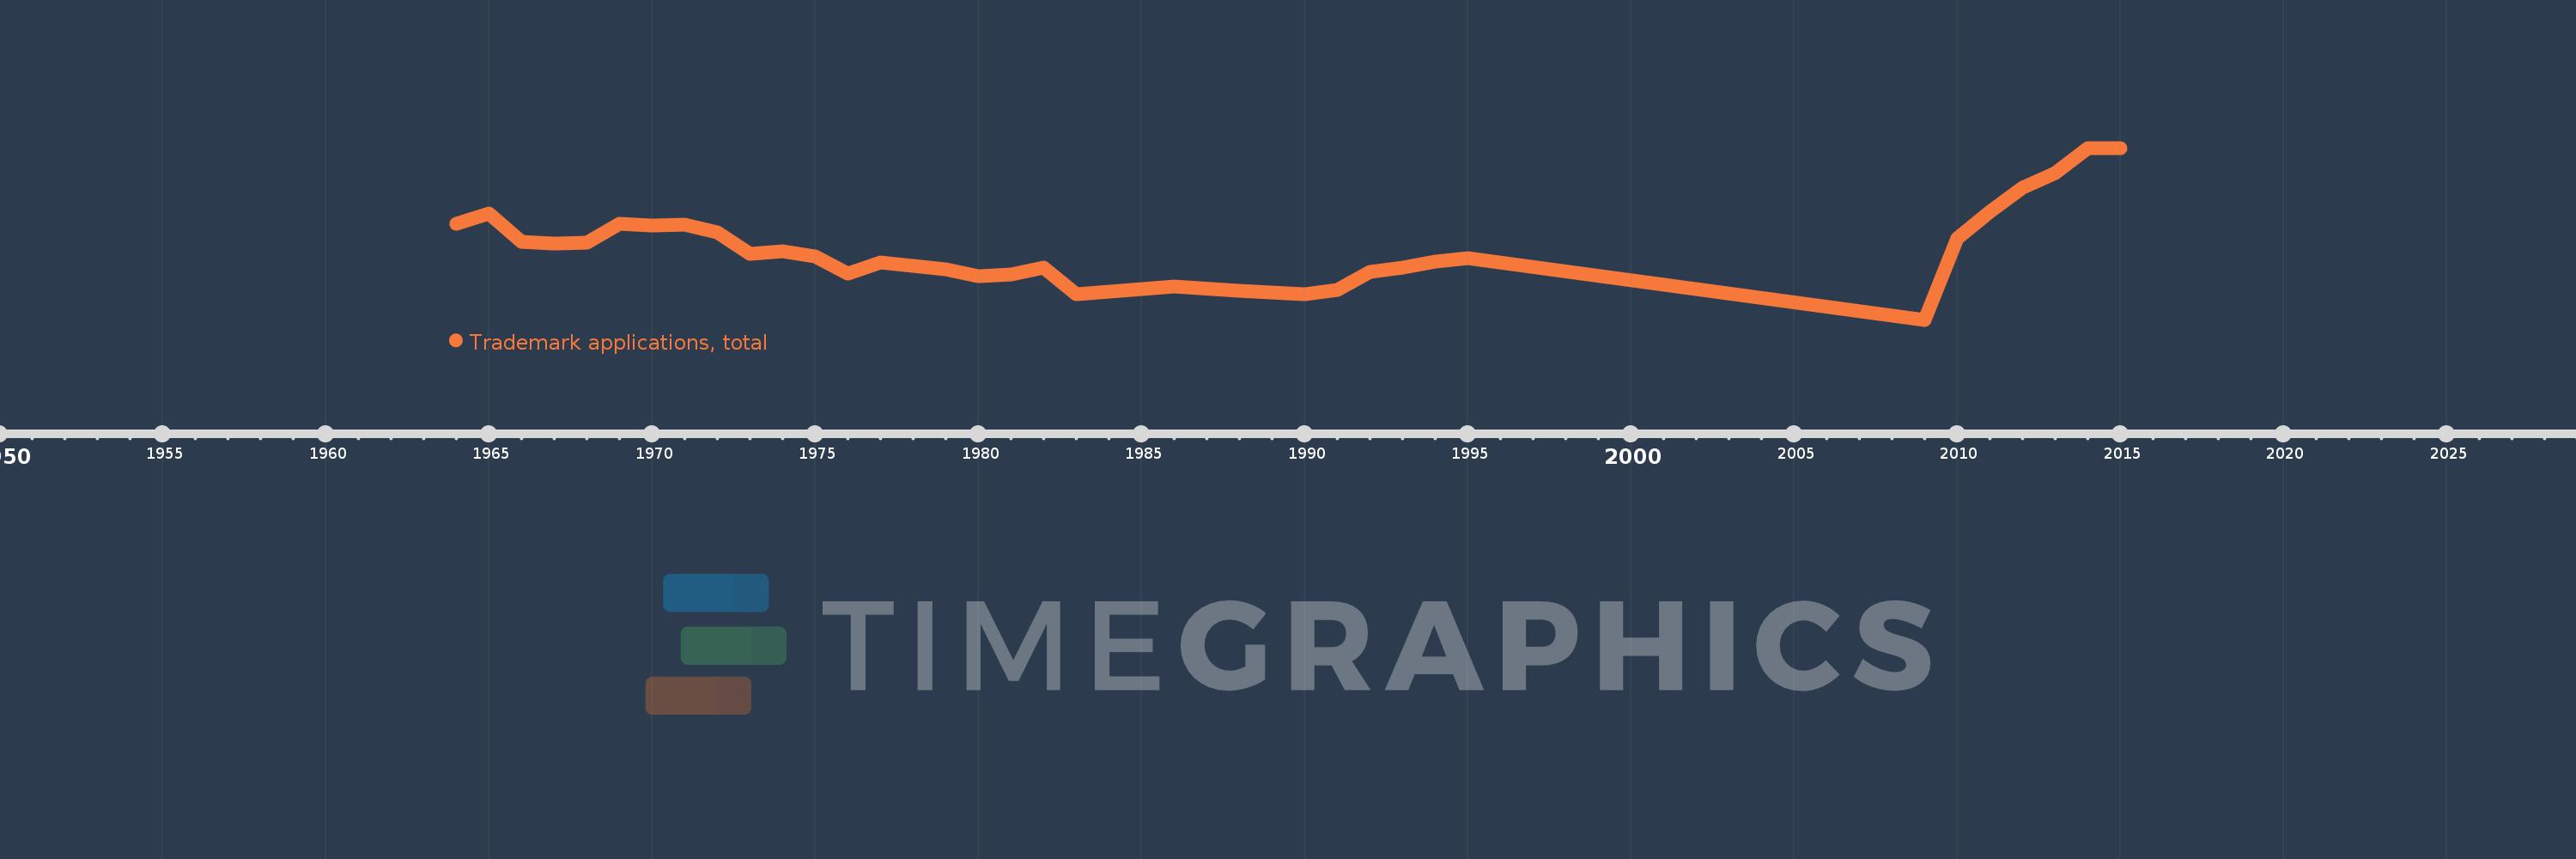
Trademark applications, total
2015,2014,2013,2012,2011,2010,2009,1995,1994,1993,1992,1991,1990,1988,1986,1983,1982,1981,1980,1979,1978,1977,1976,1975,1974,1973,1972,1971,1970,1969,1968,1967,1966,1965,1964