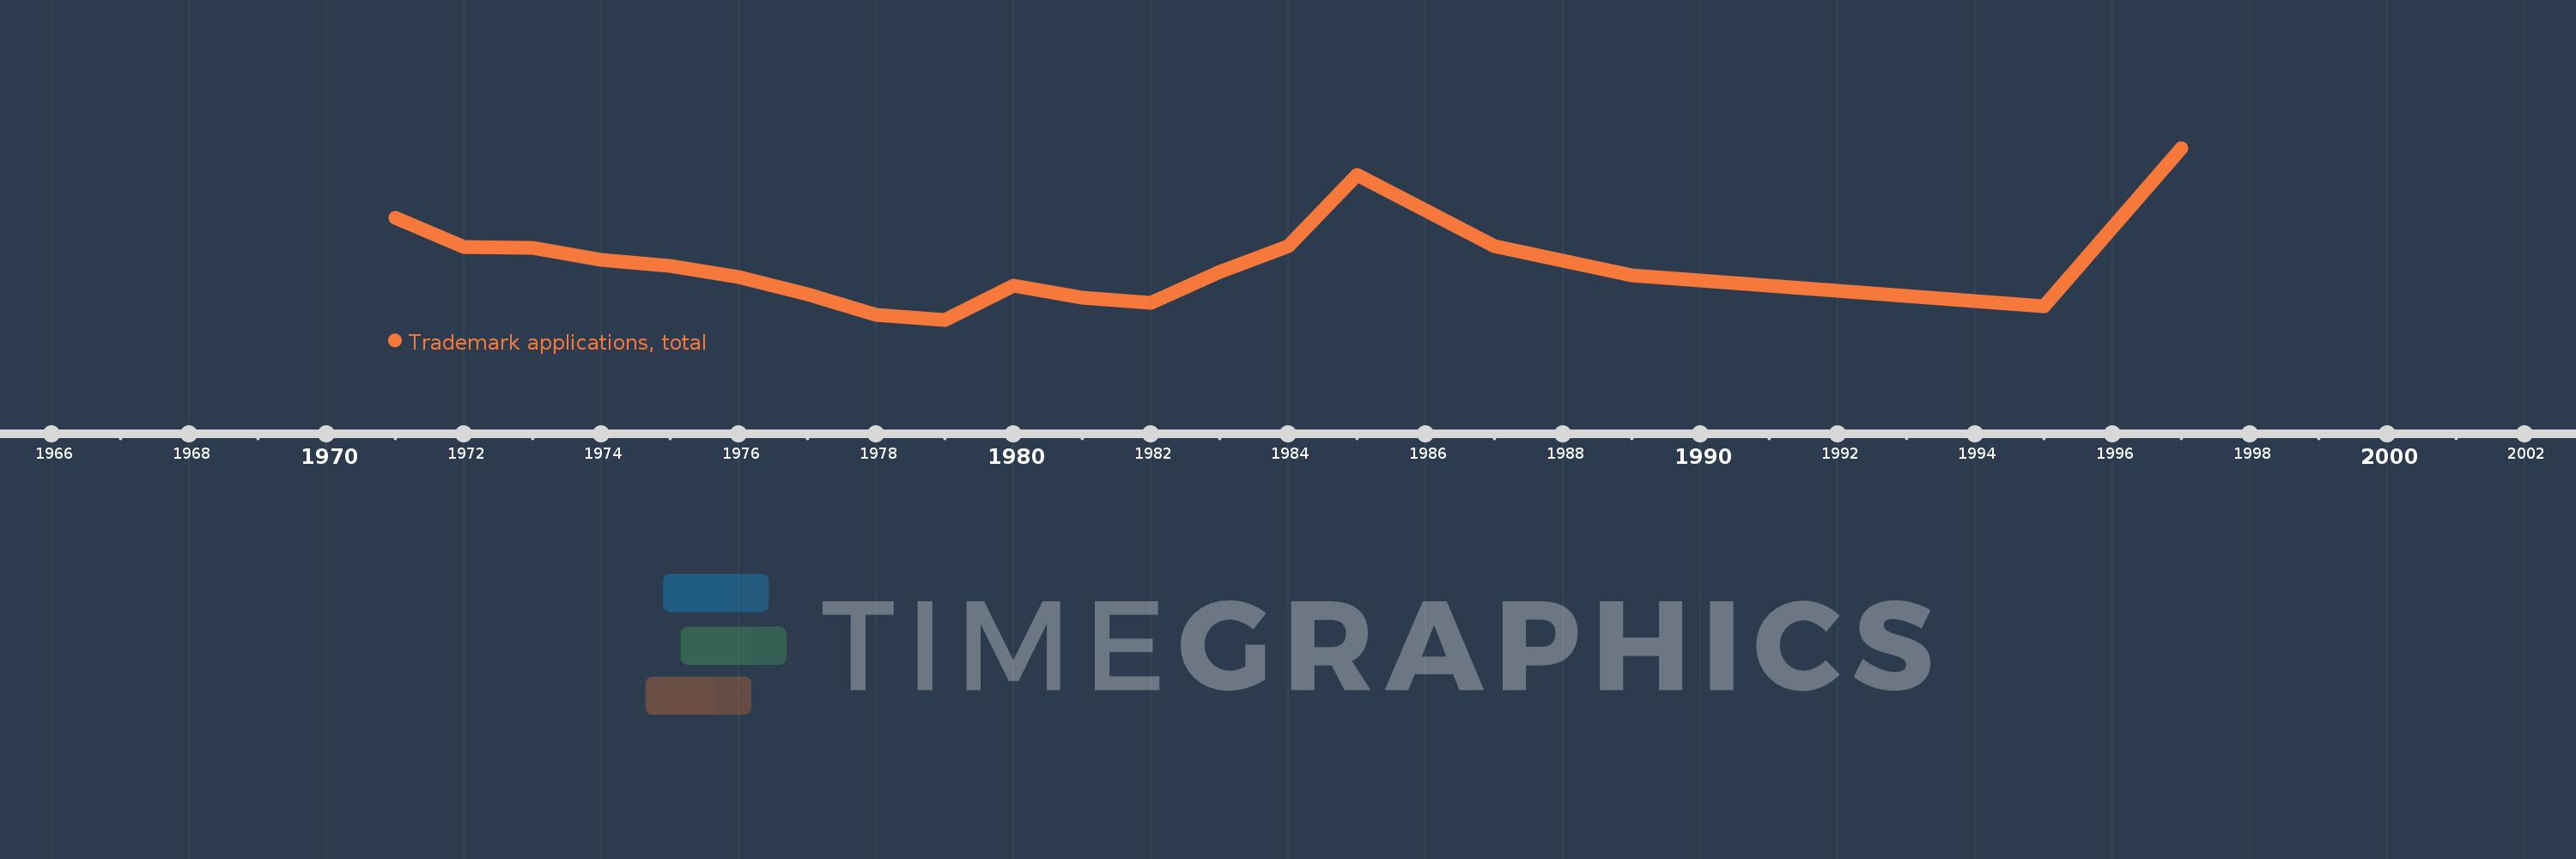
Questa scala temporale mostra un grafico dal 1971 anno al 1997 anno. Congo, Dem. Rep.. I dati fino ad 1970 anno non disponibili. Il numero di osservazioni attuali secondo i date: 20.
La fonte (nome):
Indicatori dello sviluppo mondiale
La fonte (organizzazione):
World Intellectual Property Organization (WIPO), World Intellectual Property Indicators and www.wipo.int/econ_stat. The International Bureau of WIPO assumes no responsibility with respect to the transformation of these data.
Categorie:
Science & Technology
sono stati aggiornati
23 apr 2017 anni
Indicatori delle variazioni dei valori per anni
In media:
379.8
Minima:
210.0
1 gen 1979 anni
Massimo:
709.0
1 gen 1997 anni
Alla data di osservazione
Valore
Variazione assoluta
La variazione rispetto al valore precedente
1 gen 1971 anni
505.0
+505.0
0.0%
1 gen 1972 anni
421.0
-84.0
-16.63%
1 gen 1973 anni
420.0
-1.0
-0.24%
1 gen 1974 anni
384.0
-36.0
-8.57%
1 gen 1975 anni
366.0
-18.0
-4.69%
1 gen 1976 anni
334.0
-32.0
-8.74%
1 gen 1977 anni
284.0
-50.0
-14.97%
1 gen 1978 anni
225.0
-59.0
-20.77%
1 gen 1979 anni
210.0
-15.0
-6.67%
1 gen 1980 anni
309.0
+99.0
47.14%
1 gen 1981 anni
274.0
-35.0
-11.33%
1 gen 1982 anni
258.0
-16.0
-5.84%
1 gen 1983 anni
350.0
+92.0
35.66%
1 gen 1984 anni
424.0
+74.0
21.14%
1 gen 1985 anni
631.0
+207.0
48.82%
1 gen 1987 anni
424.0
-207.0
-32.81%
1 gen 1989 anni
340.0
-84.0
-19.81%
1 gen 1995 anni
250.0
-90.0
-26.47%
1 gen 1996 anni
478.0
+228.0
91.2%
1 gen 1997 anni
709.0
+231.0
48.33%
Classificazione dei paesi secondo i statistiche attuali per anni