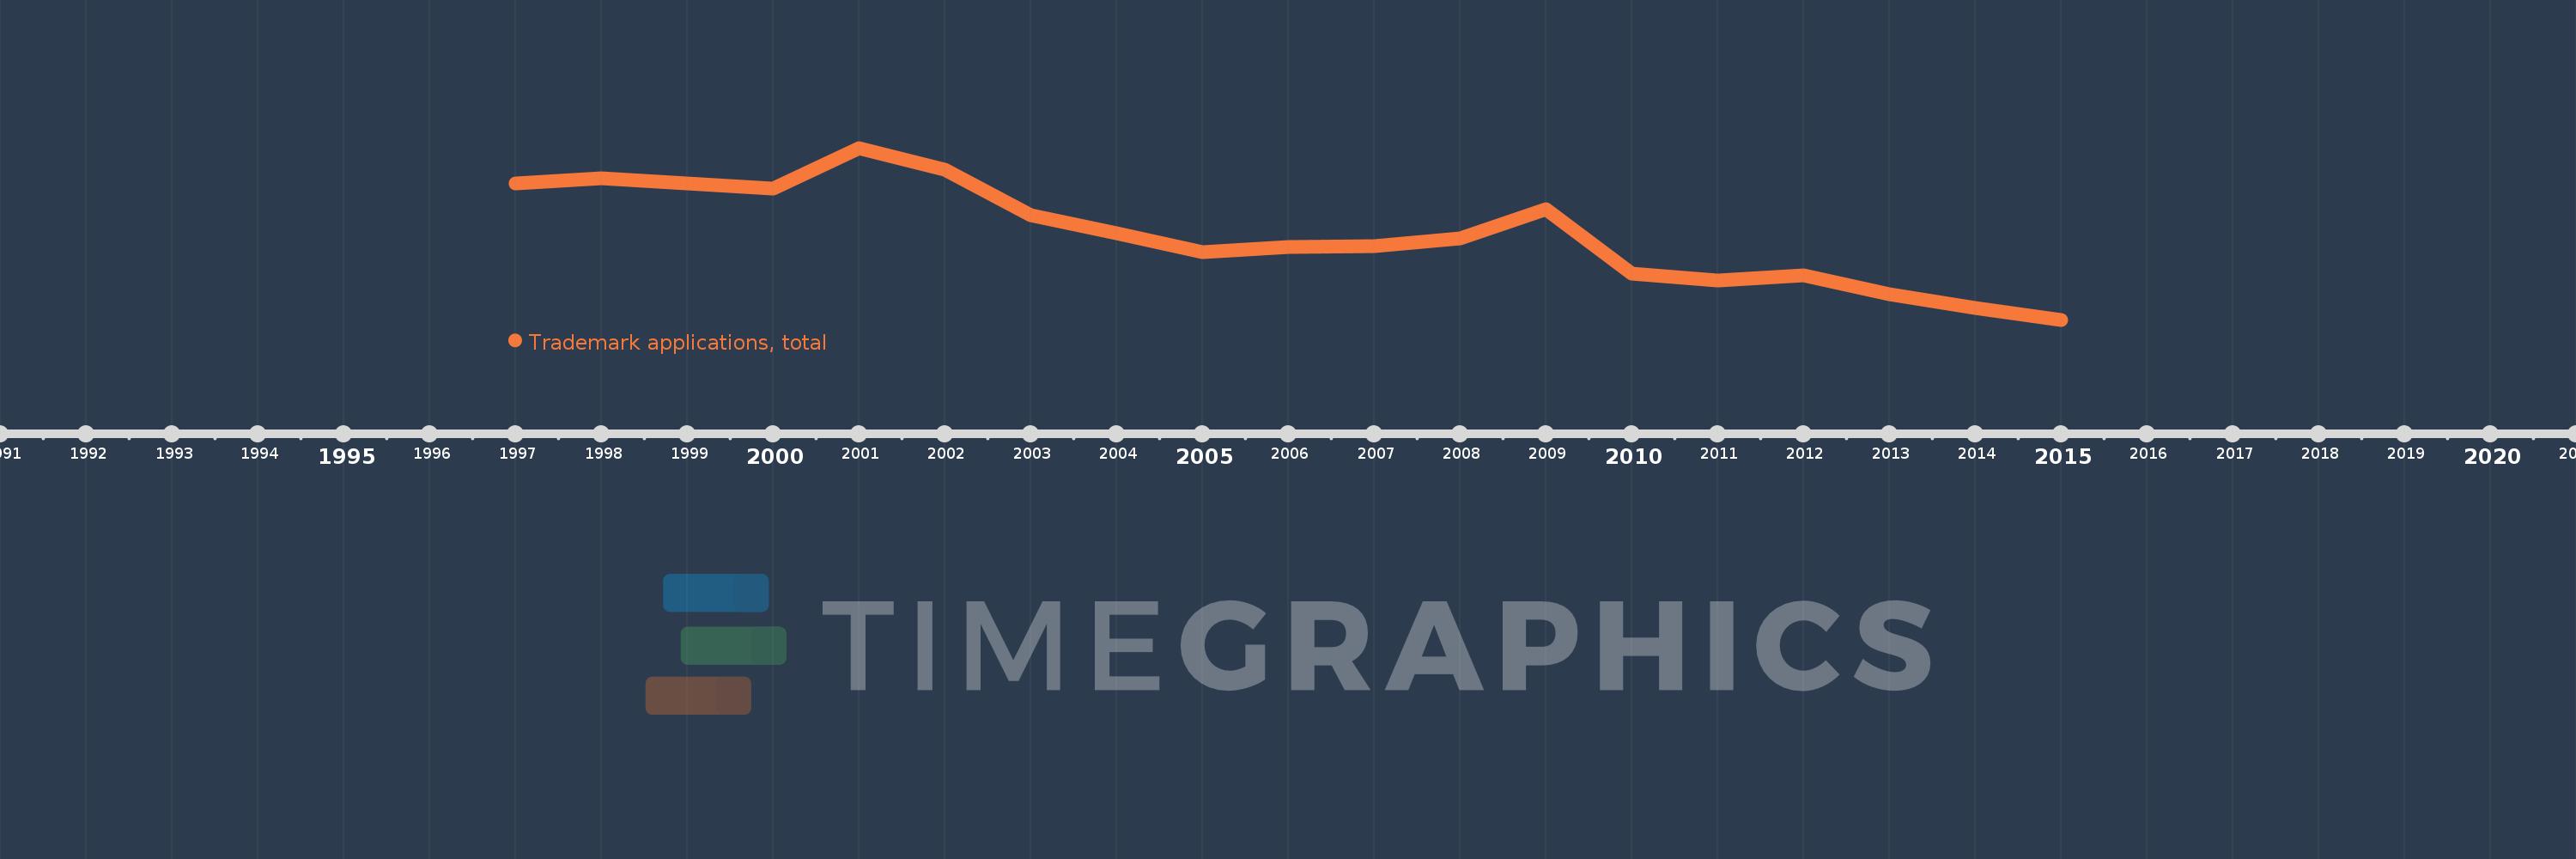
Questa scala temporale mostra un grafico dal 1997 anno al 2015 anno. San Marino. I dati fino ad 1996 anno non disponibili. Il numero di osservazioni attuali secondo i date: 19.
La fonte (nome):
Indicatori dello sviluppo mondiale
La fonte (organizzazione):
World Intellectual Property Organization (WIPO), World Intellectual Property Indicators and www.wipo.int/econ_stat. The International Bureau of WIPO assumes no responsibility with respect to the transformation of these data.
Categorie:
Science & Technology
sono stati aggiornati
23 apr 2017 anni
Indicatori delle variazioni dei valori per anni
In media:
1.822 Mille.
Minima:
1.009 Mille.
1 gen 2015 anni
Massimo:
2.636 Mille.
1 gen 2001 anni
Alla data di osservazione
Valore
Variazione assoluta
La variazione rispetto al valore precedente
1 gen 1997 anni
2.304 Mille.
+2.304 Mille.
0.0%
1 gen 1998 anni
2.352 Mille.
+48.0
2.08%
1 gen 1999 anni
2.299 Mille.
-53.0
-2.25%
1 gen 2000 anni
2.249 Mille.
-50.0
-2.17%
1 gen 2001 anni
2.636 Mille.
+387.0
17.21%
1 gen 2002 anni
2.429 Mille.
-207.0
-7.85%
1 gen 2003 anni
2.002 Mille.
-427.0
-17.58%
1 gen 2004 anni
1.83 Mille.
-172.0
-8.59%
1 gen 2005 anni
1.65 Mille.
-180.0
-9.84%
1 gen 2006 anni
1.701 Mille.
+51.0
3.09%
1 gen 2007 anni
1.707 Mille.
+6.0
0.35%
1 gen 2008 anni
1.777 Mille.
+70.0
4.1%
1 gen 2009 anni
2.058 Mille.
+281.0
15.81%
1 gen 2010 anni
1.443 Mille.
-615.0
-29.88%
1 gen 2011 anni
1.378 Mille.
-65.0
-4.5%
1 gen 2012 anni
1.428 Mille.
+50.0
3.63%
1 gen 2013 anni
1.247 Mille.
-181.0
-12.68%
1 gen 2014 anni
1.124 Mille.
-123.0
-9.86%
1 gen 2015 anni
1.009 Mille.
-115.0
-10.23%
Classificazione dei paesi secondo i statistiche attuali per anni