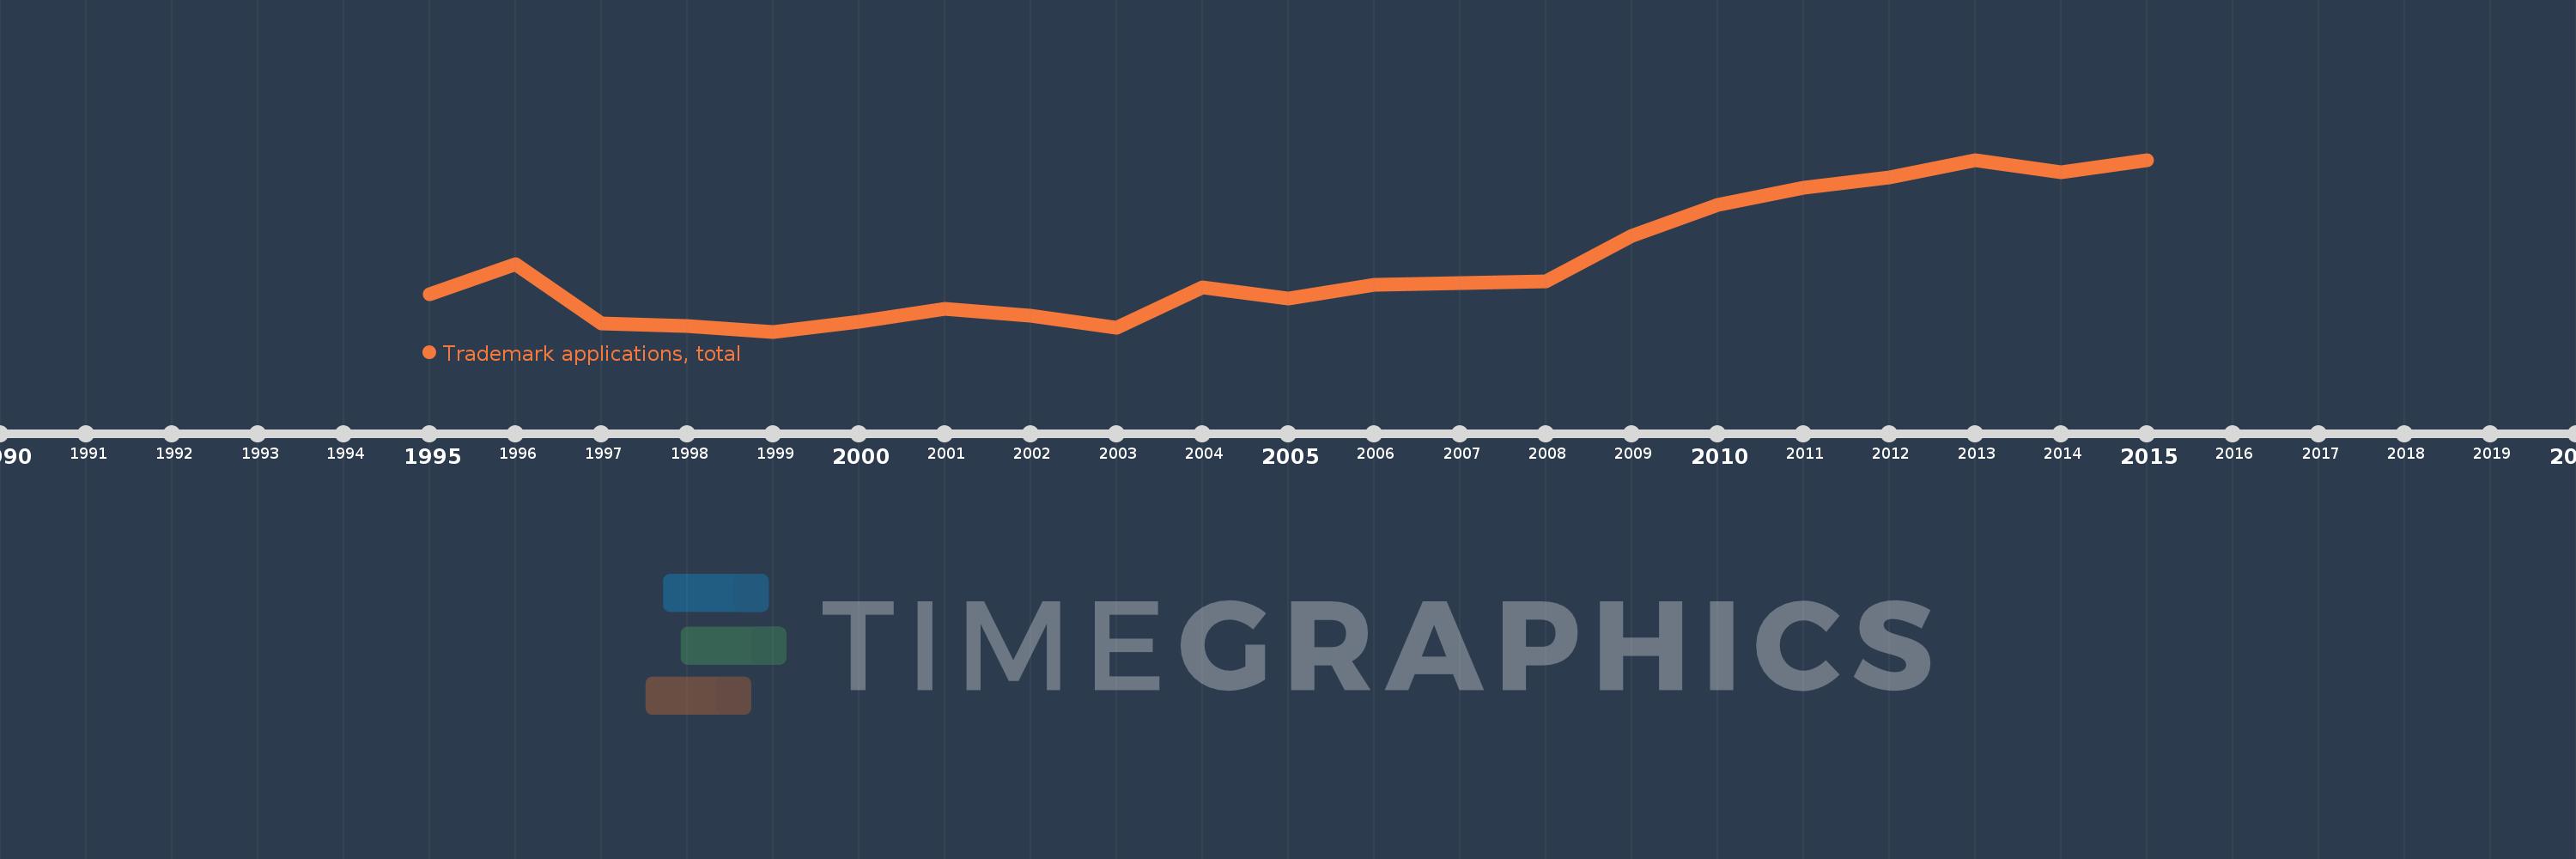
Questa scala temporale mostra un grafico dal 1995 anno al 2015 anno. Madagascar. I dati fino ad 1994 anno non disponibili. Il numero di osservazioni attuali secondo i date: 21.
La fonte (nome):
Indicatori dello sviluppo mondiale
La fonte (organizzazione):
World Intellectual Property Organization (WIPO), World Intellectual Property Indicators and www.wipo.int/econ_stat. The International Bureau of WIPO assumes no responsibility with respect to the transformation of these data.
Categorie:
Science & Technology
sono stati aggiornati
23 apr 2017 anni
Indicatori delle variazioni dei valori per anni
In media:
1.053 Mille.
Minima:
420.0
1 gen 1999 anni
Massimo:
2.03 Mille.
1 gen 2013 anni
Alla data di osservazione
Valore
Variazione assoluta
La variazione rispetto al valore precedente
1 gen 1995 anni
771.0
+771.0
0.0%
1 gen 1996 anni
1.048 Mille.
+277.0
35.93%
1 gen 1997 anni
500.0
-548.0
-52.29%
1 gen 1998 anni
473.0
-27.0
-5.4%
1 gen 1999 anni
420.0
-53.0
-11.21%
1 gen 2000 anni
510.0
+90.0
21.43%
1 gen 2001 anni
635.0
+125.0
24.51%
1 gen 2002 anni
572.0
-63.0
-9.92%
1 gen 2003 anni
455.0
-117.0
-20.45%
1 gen 2004 anni
831.0
+376.0
82.64%
1 gen 2005 anni
732.0
-99.0
-11.91%
1 gen 2006 anni
858.0
+126.0
17.21%
1 gen 2007 anni
878.0
+20.0
2.33%
1 gen 2008 anni
894.0
+16.0
1.82%
1 gen 2009 anni
1.318 Mille.
+424.0
47.43%
1 gen 2010 anni
1.605 Mille.
+287.0
21.78%
1 gen 2011 anni
1.772 Mille.
+167.0
10.4%
1 gen 2012 anni
1.869 Mille.
+97.0
5.47%
1 gen 2013 anni
2.03 Mille.
+161.0
8.61%
1 gen 2014 anni
1.914 Mille.
-116.0
-5.71%
1 gen 2015 anni
2.028 Mille.
+114.0
5.96%
Classificazione dei paesi secondo i statistiche attuali per anni