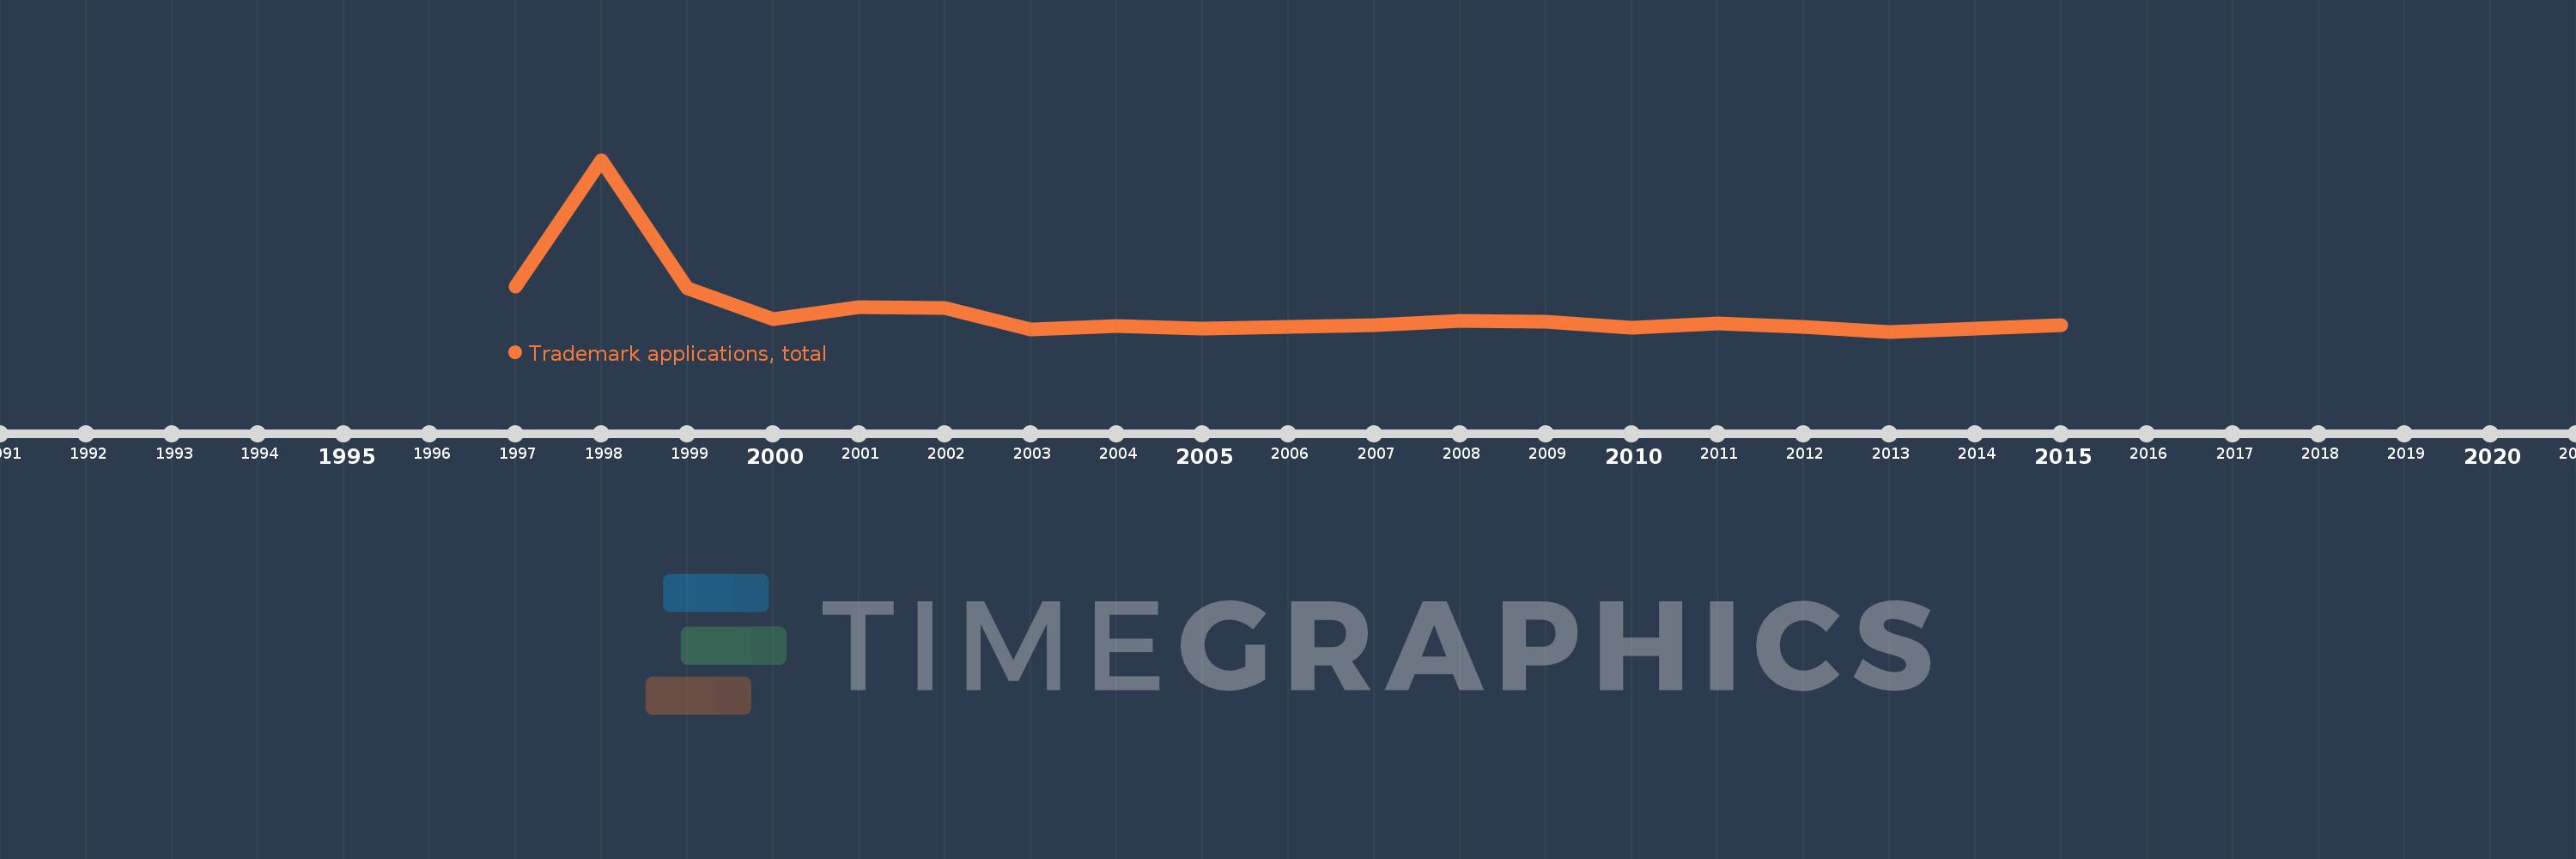
Questa scala temporale mostra un grafico dal 1997 anno al 2015 anno. Andorra. I dati fino ad 1996 anno non disponibili. Il numero di osservazioni attuali secondo i date: 18.
La fonte (nome):
Indicatori dello sviluppo mondiale
La fonte (organizzazione):
World Intellectual Property Organization (WIPO), World Intellectual Property Indicators and www.wipo.int/econ_stat. The International Bureau of WIPO assumes no responsibility with respect to the transformation of these data.
Categorie:
Science & Technology
sono stati aggiornati
23 apr 2017 anni
Indicatori delle variazioni dei valori per anni
In media:
1.499 Mille.
Minima:
620.0
1 gen 2013 anni
Massimo:
7.643 Mille.
1 gen 1998 anni
Alla data di osservazione
Valore
Variazione assoluta
La variazione rispetto al valore precedente
1 gen 1997 anni
2.449 Mille.
+2.449 Mille.
0.0%
1 gen 1998 anni
7.643 Mille.
+5.194 Mille.
212.09%
1 gen 1999 anni
2.404 Mille.
-5.239 Mille.
-68.55%
1 gen 2000 anni
1.141 Mille.
-1.263 Mille.
-52.54%
1 gen 2001 anni
1.62 Mille.
+479.0
41.98%
1 gen 2002 anni
1.578 Mille.
-42.0
-2.59%
1 gen 2003 anni
725.0
-853.0
-54.06%
1 gen 2004 anni
859.0
+134.0
18.48%
1 gen 2005 anni
741.0
-118.0
-13.74%
1 gen 2006 anni
806.0
+65.0
8.77%
1 gen 2007 anni
876.0
+70.0
8.68%
1 gen 2008 anni
1.071 Mille.
+195.0
22.26%
1 gen 2009 anni
1.021 Mille.
-50.0
-4.67%
1 gen 2010 anni
785.0
-236.0
-23.11%
1 gen 2011 anni
948.0
+163.0
20.76%
1 gen 2012 anni
803.0
-145.0
-15.3%
1 gen 2013 anni
620.0
-183.0
-22.79%
1 gen 2015 anni
896.0
+276.0
44.52%
Classificazione dei paesi secondo i statistiche attuali per anni