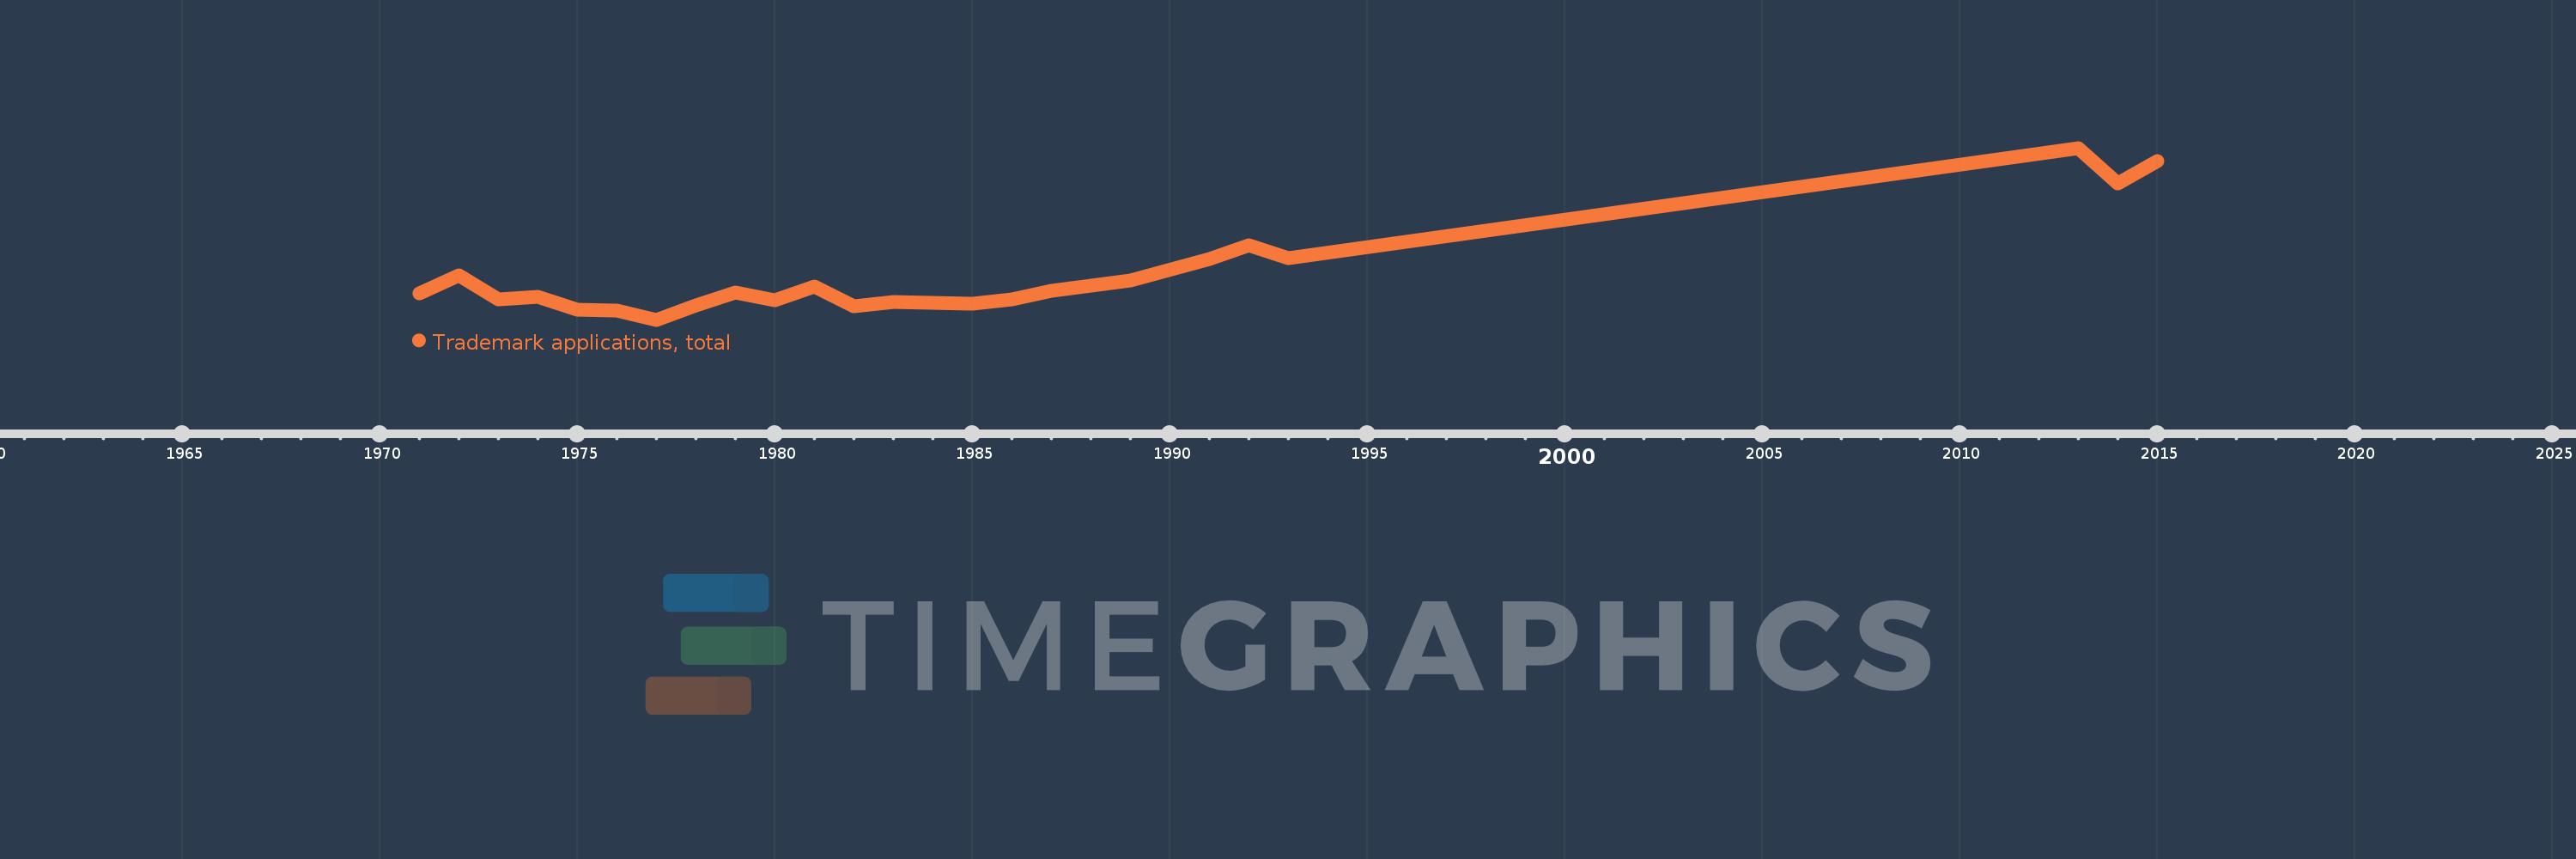
Questa scala temporale mostra un grafico dal 1971 anno al 2015 anno. Bahamas, The. I dati fino ad 1970 anno non disponibili. Il numero di osservazioni attuali secondo i date: 23.
La fonte (nome):
Indicatori dello sviluppo mondiale
La fonte (organizzazione):
World Intellectual Property Organization (WIPO), World Intellectual Property Indicators and www.wipo.int/econ_stat. The International Bureau of WIPO assumes no responsibility with respect to the transformation of these data.
Categorie:
Science & Technology
sono stati aggiornati
23 apr 2017 anni
Indicatori delle variazioni dei valori per anni
In media:
498.043
Minima:
253.0
1 gen 1977 anni
Massimo:
1.196 Mille.
1 gen 2013 anni
Alla data di osservazione
Valore
Variazione assoluta
La variazione rispetto al valore precedente
1 gen 1971 anni
400.0
+400.0
0.0%
1 gen 1972 anni
496.0
+96.0
24.0%
1 gen 1973 anni
364.0
-132.0
-26.61%
1 gen 1974 anni
380.0
+16.0
4.4%
1 gen 1975 anni
306.0
-74.0
-19.47%
1 gen 1976 anni
302.0
-4.0
-1.31%
1 gen 1977 anni
253.0
-49.0
-16.23%
1 gen 1978 anni
330.0
+77.0
30.43%
1 gen 1979 anni
401.0
+71.0
21.52%
1 gen 1980 anni
359.0
-42.0
-10.47%
1 gen 1981 anni
436.0
+77.0
21.45%
1 gen 1982 anni
326.0
-110.0
-25.23%
1 gen 1983 anni
349.0
+23.0
7.06%
1 gen 1985 anni
339.0
-10.0
-2.87%
1 gen 1986 anni
366.0
+27.0
7.96%
1 gen 1987 anni
413.0
+47.0
12.84%
1 gen 1989 anni
470.0
+57.0
13.8%
1 gen 1991 anni
588.0
+118.0
25.11%
1 gen 1992 anni
661.0
+73.0
12.41%
1 gen 1993 anni
593.0
-68.0
-10.29%
1 gen 2013 anni
1.196 Mille.
+603.0
101.69%
1 gen 2014 anni
1.003 Mille.
-193.0
-16.14%
1 gen 2015 anni
1.124 Mille.
+121.0
12.06%
Classificazione dei paesi secondo i statistiche attuali per anni