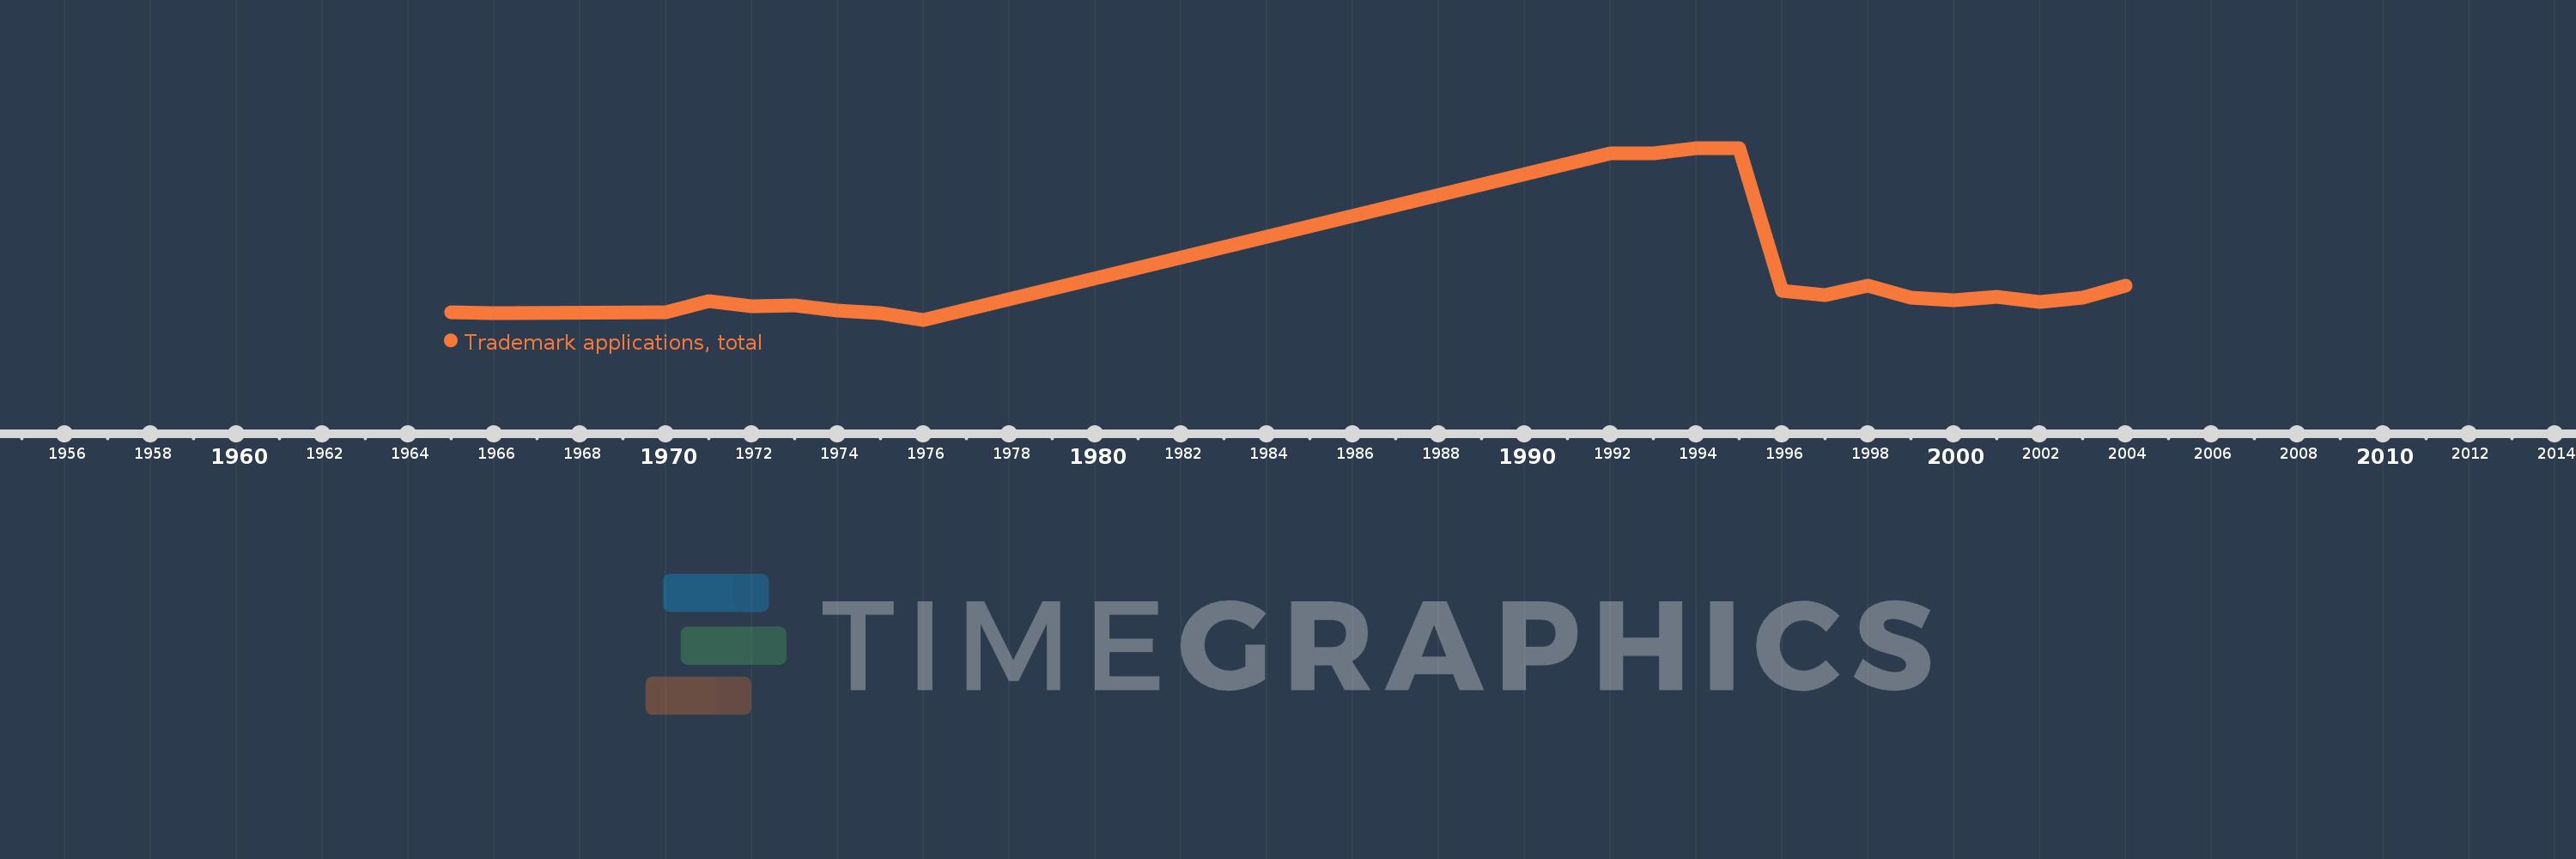
Questa scala temporale mostra un grafico dal 1965 anno al 2004 anno. Lao PDR. I dati fino ad 1964 anno non disponibili. Il numero di osservazioni attuali secondo i date: 22.
La fonte (nome):
Indicatori dello sviluppo mondiale
La fonte (organizzazione):
World Intellectual Property Organization (WIPO), World Intellectual Property Indicators and www.wipo.int/econ_stat. The International Bureau of WIPO assumes no responsibility with respect to the transformation of these data.
Categorie:
Science & Technology
sono stati aggiornati
23 apr 2017 anni
Indicatori delle variazioni dei valori per anni
In media:
1.316 Mille.
Minima:
74.0
1 gen 1976 anni
Massimo:
4.835 Mille.
1 gen 1995 anni
Alla data di osservazione
Valore
Variazione assoluta
La variazione rispetto al valore precedente
1 gen 1965 anni
281.0
+281.0
0.0%
1 gen 1966 anni
257.0
-24.0
-8.54%
1 gen 1970 anni
282.0
+25.0
9.73%
1 gen 1971 anni
584.0
+302.0
107.09%
1 gen 1972 anni
446.0
-138.0
-23.63%
1 gen 1973 anni
471.0
+25.0
5.61%
1 gen 1974 anni
319.0
-152.0
-32.27%
1 gen 1975 anni
266.0
-53.0
-16.61%
1 gen 1976 anni
74.0
-192.0
-72.18%
1 gen 1992 anni
4.686 Mille.
+4.612 Mille.
6.23 Mille.%
1 gen 1993 anni
4.69 Mille.
+4.0
0.09%
1 gen 1994 anni
4.821 Mille.
+131.0
2.79%
1 gen 1995 anni
4.835 Mille.
+14.0
0.29%
1 gen 1996 anni
884.0
-3.951 Mille.
-81.72%
1 gen 1997 anni
766.0
-118.0
-13.35%
1 gen 1998 anni
1.015 Mille.
+249.0
32.51%
1 gen 1999 anni
679.0
-336.0
-33.1%
1 gen 2000 anni
609.0
-70.0
-10.31%
1 gen 2001 anni
701.0
+92.0
15.11%
1 gen 2002 anni
577.0
-124.0
-17.69%
1 gen 2003 anni
681.0
+104.0
18.02%
1 gen 2004 anni
1.024 Mille.
+343.0
50.37%
Classificazione dei paesi secondo i statistiche attuali per anni