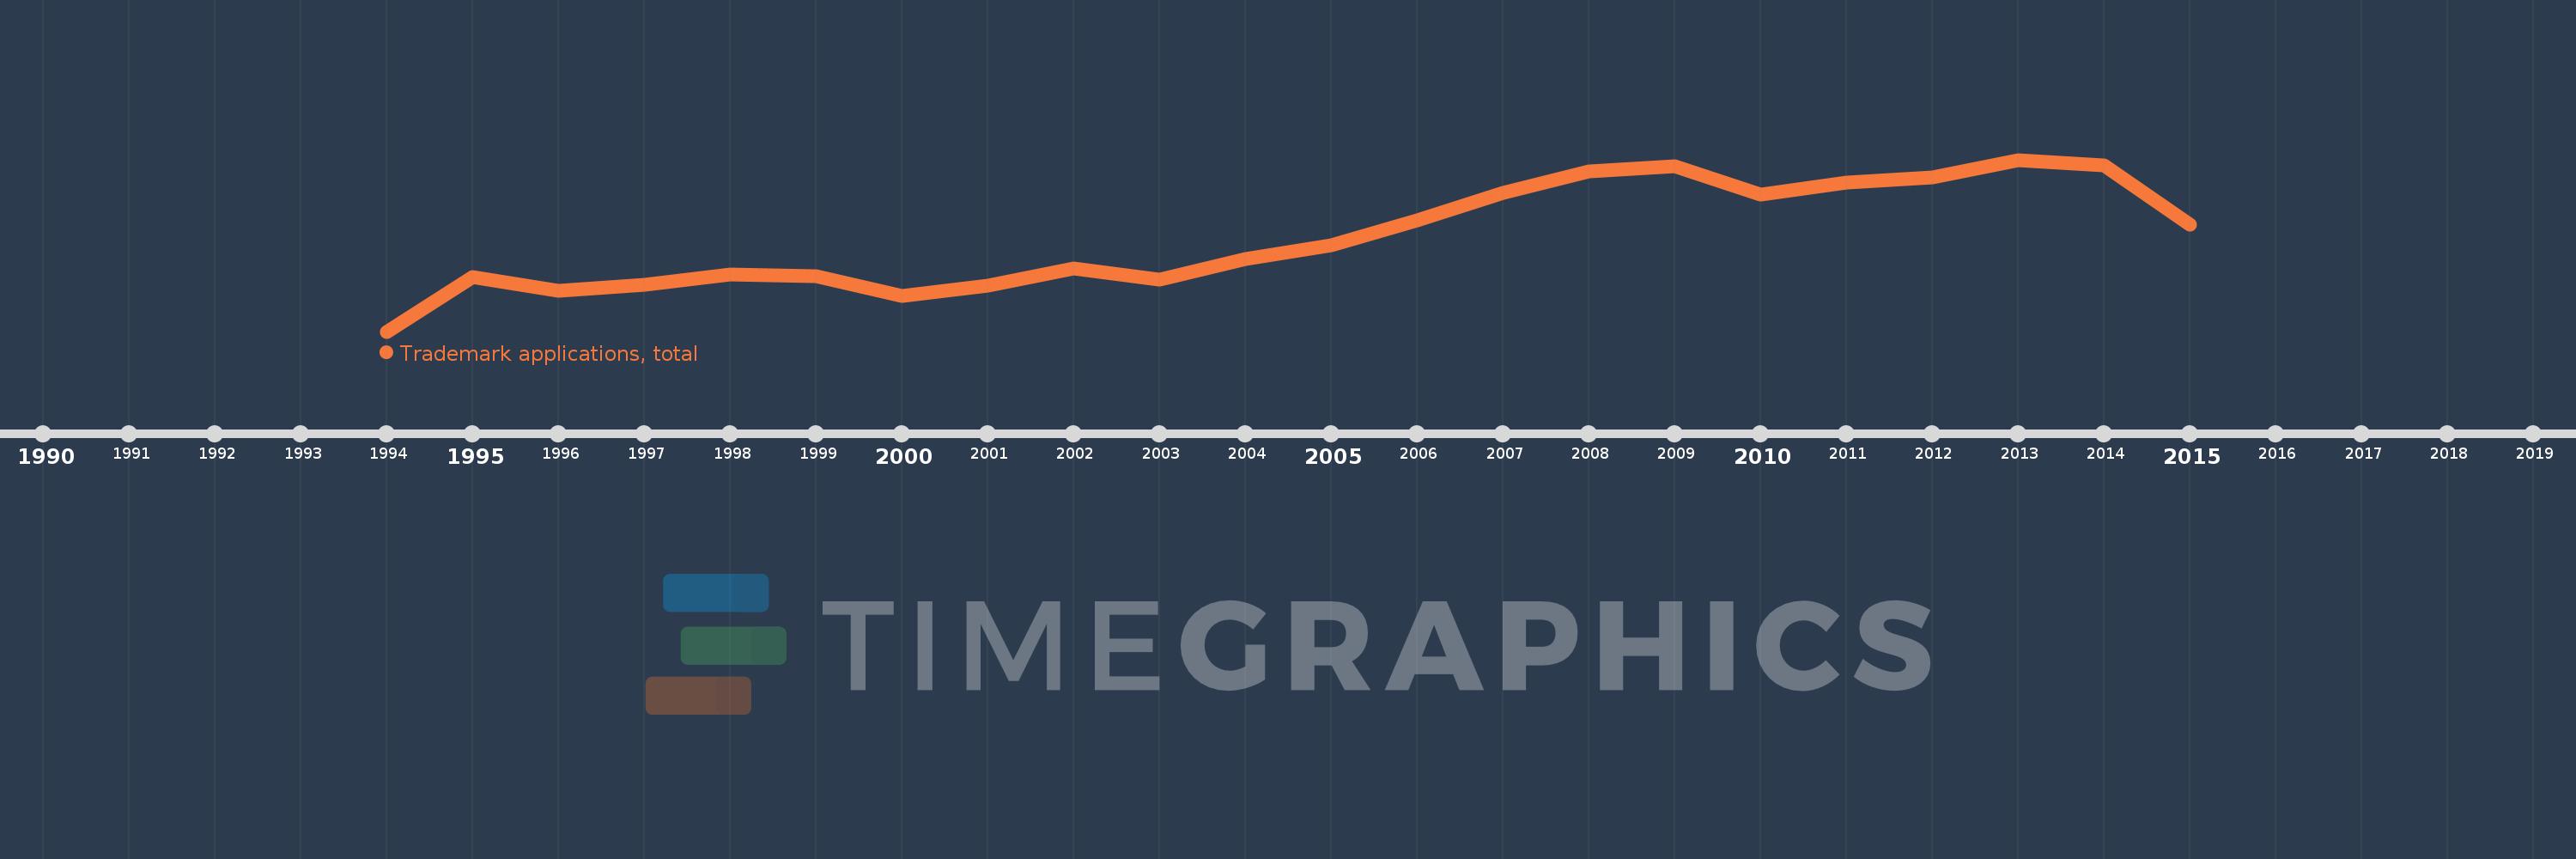
Questa scala temporale mostra un grafico dal 1994 anno al 2015 anno. Belarus. I dati fino ad 1993 anno non disponibili. Il numero di osservazioni attuali secondo i date: 22.
La fonte (nome):
Indicatori dello sviluppo mondiale
La fonte (organizzazione):
World Intellectual Property Organization (WIPO), World Intellectual Property Indicators and www.wipo.int/econ_stat. The International Bureau of WIPO assumes no responsibility with respect to the transformation of these data.
Categorie:
Science & Technology
sono stati aggiornati
23 apr 2017 anni
Indicatori delle variazioni dei valori per anni
In media:
8.194 Mille.
Minima:
3.88 Mille.
1 gen 1994 anni
Massimo:
11.75 Mille.
1 gen 2013 anni
Alla data di osservazione
Valore
Variazione assoluta
La variazione rispetto al valore precedente
1 gen 1994 anni
3.88 Mille.
+3.88 Mille.
0.0%
1 gen 1995 anni
6.37 Mille.
+2.49 Mille.
64.18%
1 gen 1996 anni
5.742 Mille.
-628.0
-9.86%
1 gen 1997 anni
6.032 Mille.
+290.0
5.05%
1 gen 1998 anni
6.513 Mille.
+481.0
7.97%
1 gen 1999 anni
6.424 Mille.
-89.0
-1.37%
1 gen 2000 anni
5.516 Mille.
-908.0
-14.13%
1 gen 2001 anni
5.986 Mille.
+470.0
8.52%
1 gen 2002 anni
6.778 Mille.
+792.0
13.23%
1 gen 2003 anni
6.278 Mille.
-500.0
-7.38%
1 gen 2004 anni
7.19 Mille.
+912.0
14.53%
1 gen 2005 anni
7.824 Mille.
+634.0
8.82%
1 gen 2006 anni
8.97 Mille.
+1.146 Mille.
14.65%
1 gen 2007 anni
10.224 Mille.
+1.254 Mille.
13.98%
1 gen 2008 anni
11.225 Mille.
+1.001 Mille.
9.79%
1 gen 2009 anni
11.454 Mille.
+229.0
2.04%
1 gen 2010 anni
10.176 Mille.
-1.278 Mille.
-11.16%
1 gen 2011 anni
10.695 Mille.
+519.0
5.1%
1 gen 2012 anni
10.959 Mille.
+264.0
2.47%
1 gen 2013 anni
11.75 Mille.
+791.0
7.22%
1 gen 2014 anni
11.492 Mille.
-258.0
-2.2%
1 gen 2015 anni
8.797 Mille.
-2.695 Mille.
-23.45%
Classificazione dei paesi secondo i statistiche attuali per anni