29
/fr/
fr
AIzaSyAYiBZKx7MnpbEhh9jyipgxe19OcubqV5w
April 1, 2024
80210
Belarus
BLR
true
2
1
Arms exports (SIPRI trend indicator values)
2016,2015,2014,2013,2012,2011,2010,2009,2008,2007,2006,2005,2004,2003,2002,2001,2000,1999,1998,1997,1996,1994
Download
Bibliothèque de statistiques globales →Belarus →

Arms exports (SIPRI trend indicator values)

Cette statistique dans les autres pays:
AfghanistanAlbaniaAlgeriaAngolaArab WorldArgentinaArubaAustraliaAustriaBahamas, TheBahrainBangladeshBelarusBelgiumBosnia and HerzegovinaBotswanaBrazilBrunei DarussalamBulgariaCambodiaCanadaCentral Europe and the BalticsChadChileChinaColombiaCongo, Dem. Rep.Costa RicaCote d'IvoireCroatiaCubaCyprusCzech RepublicDenmarkEarly-demographic dividendEast Asia & PacificEast Asia & Pacific (excluding high income)East Asia & Pacific (IDA & IBRD countries)EcuadorEgypt, Arab Rep.El SalvadorEritreaEstoniaEthiopiaEuro areaEurope & Central AsiaEurope & Central Asia (excluding high income)Europe & Central Asia (IDA & IBRD countries)European UnionFijiFinlandFragile and conflict affected situationsFranceGabonGeorgiaGermanyGhanaGreeceGuyanaHeavily indebted poor countries (HIPC)High incomeHungaryIBRD onlyIcelandIDA & IBRD totalIDA blendIDA onlyIDA totalIndiaIndonesiaIran, Islamic Rep.IraqIrelandIsraelItalyJapanJordanKazakhstanKenyaKorea, Dem. People’s Rep.Korea, Rep.KuwaitKyrgyz RepublicLate-demographic dividendLatin America & Caribbean Latin America & Caribbean (excluding high income)Latin America & the Caribbean (IDA & IBRD countries)LatviaLeast developed countries: UN classificationLebanonLibyaLithuaniaLow & middle incomeLow incomeLower middle incomeLuxembourgMacedonia, FYRMalawiMalaysiaMaltaMiddle East & North AfricaMiddle East & North Africa (excluding high income)Middle East & North Africa (IDA & IBRD countries)Middle incomeMoldovaMontenegroMoroccoMozambiqueNetherlandsNew ZealandNicaraguaNigerNigeriaNorth AmericaNorwayOECD membersOmanPakistanPanamaPeruPhilippinesPolandPortugalPost-demographic dividendPre-demographic dividendQatarRomaniaRussian FederationSaudi ArabiaSenegalSerbiaSeychellesSingaporeSlovak RepublicSouth AfricaSouth AsiaSouth Asia (IDA & IBRD)SpainSri LankaSub-Saharan Africa Sub-Saharan Africa (excluding high income)Sub-Saharan Africa (IDA & IBRD countries)SudanSwedenSwitzerlandSyrian Arab RepublicThailandTurkeyUgandaUkraineUnited Arab EmiratesUnited KingdomUnited StatesUpper middle incomeUruguayUzbekistanVenezuela, RBVietnamYemen, Rep.ZambiaZimbabwe
La ligne de temps
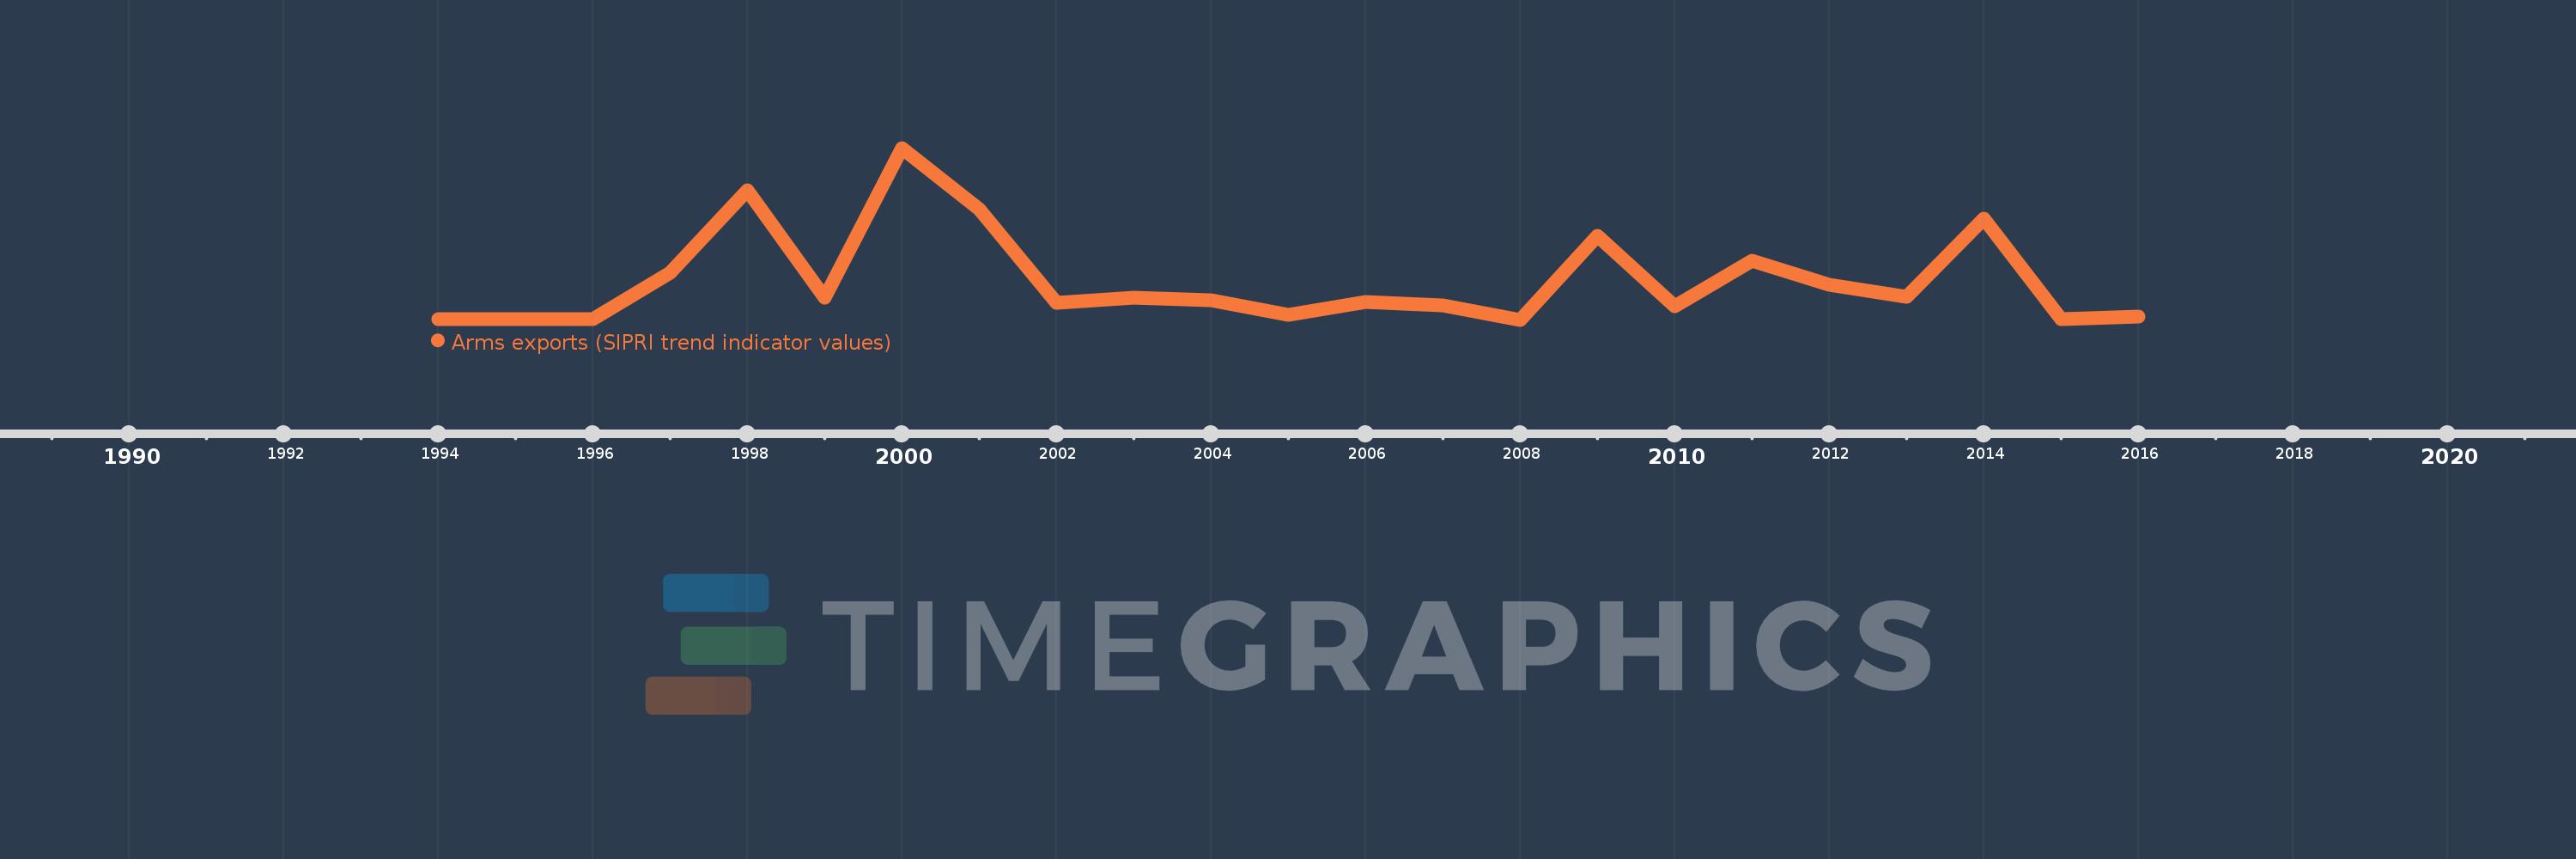
Cette échelle de temps montre un graphique de 1994 année à 2016 année Belarus. Les données jusqu'à 1993 année ne sont pas présentés. Quantité d'observations actuelles selon dates: 22.
Source (désignation):
Les indicateurs du développement mondiale
Source (organisation):
Stockholm International Peace Research Institute (SIPRI), Arms Transfers Programme (http://portal.sipri.org/publications/pages/transfer/splash).
Catégories:
Public Sector, Trade
Dernière mise à jour
23 avr. 2017
Les indicateurs de changement de valeurs selon les années
En moyenne:
111.773 mln.
Minimum:
6.0 mln.
1 janv. 2008
Maximum:
452.0 mln.
1 janv. 2000
Pour la date d''observation
Valeur
Changement absolu
Le changement par rapport à la valeur précédente
1 janv. 1994
8.0 mln.
+8.0 mln.
0.0%
1 janv. 1996
7.0 mln.
-1000.0 milles
-12.5%
1 janv. 1997
129.0 mln.
+122.0 mln.
1.74 milles%
1 janv. 1998
341.0 mln.
+212.0 mln.
164.34%
1 janv. 1999
63.0 mln.
-278.0 mln.
-81.52%
1 janv. 2000
452.0 mln.
+389.0 mln.
617.46%
1 janv. 2001
293.0 mln.
-159.0 mln.
-35.18%
1 janv. 2002
49.0 mln.
-244.0 mln.
-83.28%
1 janv. 2003
63.0 mln.
+14.0 mln.
28.57%
1 janv. 2004
57.0 mln.
-6.0 mln.
-9.52%
1 janv. 2005
19.0 mln.
-38.0 mln.
-66.67%
1 janv. 2006
53.0 mln.
+34.0 mln.
178.95%
1 janv. 2007
43.0 mln.
-10.0 mln.
-18.87%
1 janv. 2008
6.0 mln.
-37.0 mln.
-86.05%
1 janv. 2009
224.0 mln.
+218.0 mln.
3.63 milles%
1 janv. 2010
41.0 mln.
-183.0 mln.
-81.7%
1 janv. 2011
159.0 mln.
+118.0 mln.
287.8%
1 janv. 2012
97.0 mln.
-62.0 mln.
-38.99%
1 janv. 2013
65.0 mln.
-32.0 mln.
-32.99%
1 janv. 2014
268.0 mln.
+203.0 mln.
312.31%
1 janv. 2015
8.0 mln.
-260.0 mln.
-97.01%
1 janv. 2016
14.0 mln.
+6.0 mln.
75.0%
Classement des pays selon les statistiques actuelles par années

Commentaires:

Envoyer
PremiumAbout & FeedbackUn accordConfidentialité
logo
© 2022 Selected Technologies LLC – Morgan Hill, California