29
/fr/
fr
AIzaSyAYiBZKx7MnpbEhh9jyipgxe19OcubqV5w
April 1, 2024
241335
Slovak Republic
SVK
true
2
1
Arms exports (SIPRI trend indicator values)
2015,2013,2009,2008,2007,2005,2003,2002,2001,2000,1999,1998,1997,1996,1995,1994
Download
Bibliothèque de statistiques globales →Slovak Republic →

Arms exports (SIPRI trend indicator values)

Cette statistique dans les autres pays:
AfghanistanAlbaniaAlgeriaAngolaArab WorldArgentinaArubaAustraliaAustriaBahamas, TheBahrainBangladeshBelarusBelgiumBosnia and HerzegovinaBotswanaBrazilBrunei DarussalamBulgariaCambodiaCanadaCentral Europe and the BalticsChadChileChinaColombiaCongo, Dem. Rep.Costa RicaCote d'IvoireCroatiaCubaCyprusCzech RepublicDenmarkEarly-demographic dividendEast Asia & PacificEast Asia & Pacific (excluding high income)East Asia & Pacific (IDA & IBRD countries)EcuadorEgypt, Arab Rep.El SalvadorEritreaEstoniaEthiopiaEuro areaEurope & Central AsiaEurope & Central Asia (excluding high income)Europe & Central Asia (IDA & IBRD countries)European UnionFijiFinlandFragile and conflict affected situationsFranceGabonGeorgiaGermanyGhanaGreeceGuyanaHeavily indebted poor countries (HIPC)High incomeHungaryIBRD onlyIcelandIDA & IBRD totalIDA blendIDA onlyIDA totalIndiaIndonesiaIran, Islamic Rep.IraqIrelandIsraelItalyJapanJordanKazakhstanKenyaKorea, Dem. People’s Rep.Korea, Rep.KuwaitKyrgyz RepublicLate-demographic dividendLatin America & Caribbean Latin America & Caribbean (excluding high income)Latin America & the Caribbean (IDA & IBRD countries)LatviaLeast developed countries: UN classificationLebanonLibyaLithuaniaLow & middle incomeLow incomeLower middle incomeLuxembourgMacedonia, FYRMalawiMalaysiaMaltaMiddle East & North AfricaMiddle East & North Africa (excluding high income)Middle East & North Africa (IDA & IBRD countries)Middle incomeMoldovaMontenegroMoroccoMozambiqueNetherlandsNew ZealandNicaraguaNigerNigeriaNorth AmericaNorwayOECD membersOmanPakistanPanamaPeruPhilippinesPolandPortugalPost-demographic dividendPre-demographic dividendQatarRomaniaRussian FederationSaudi ArabiaSenegalSerbiaSeychellesSingaporeSlovak RepublicSouth AfricaSouth AsiaSouth Asia (IDA & IBRD)SpainSri LankaSub-Saharan Africa Sub-Saharan Africa (excluding high income)Sub-Saharan Africa (IDA & IBRD countries)SudanSwedenSwitzerlandSyrian Arab RepublicThailandTurkeyUgandaUkraineUnited Arab EmiratesUnited KingdomUnited StatesUpper middle incomeUruguayUzbekistanVenezuela, RBVietnamYemen, Rep.ZambiaZimbabwe
La ligne de temps
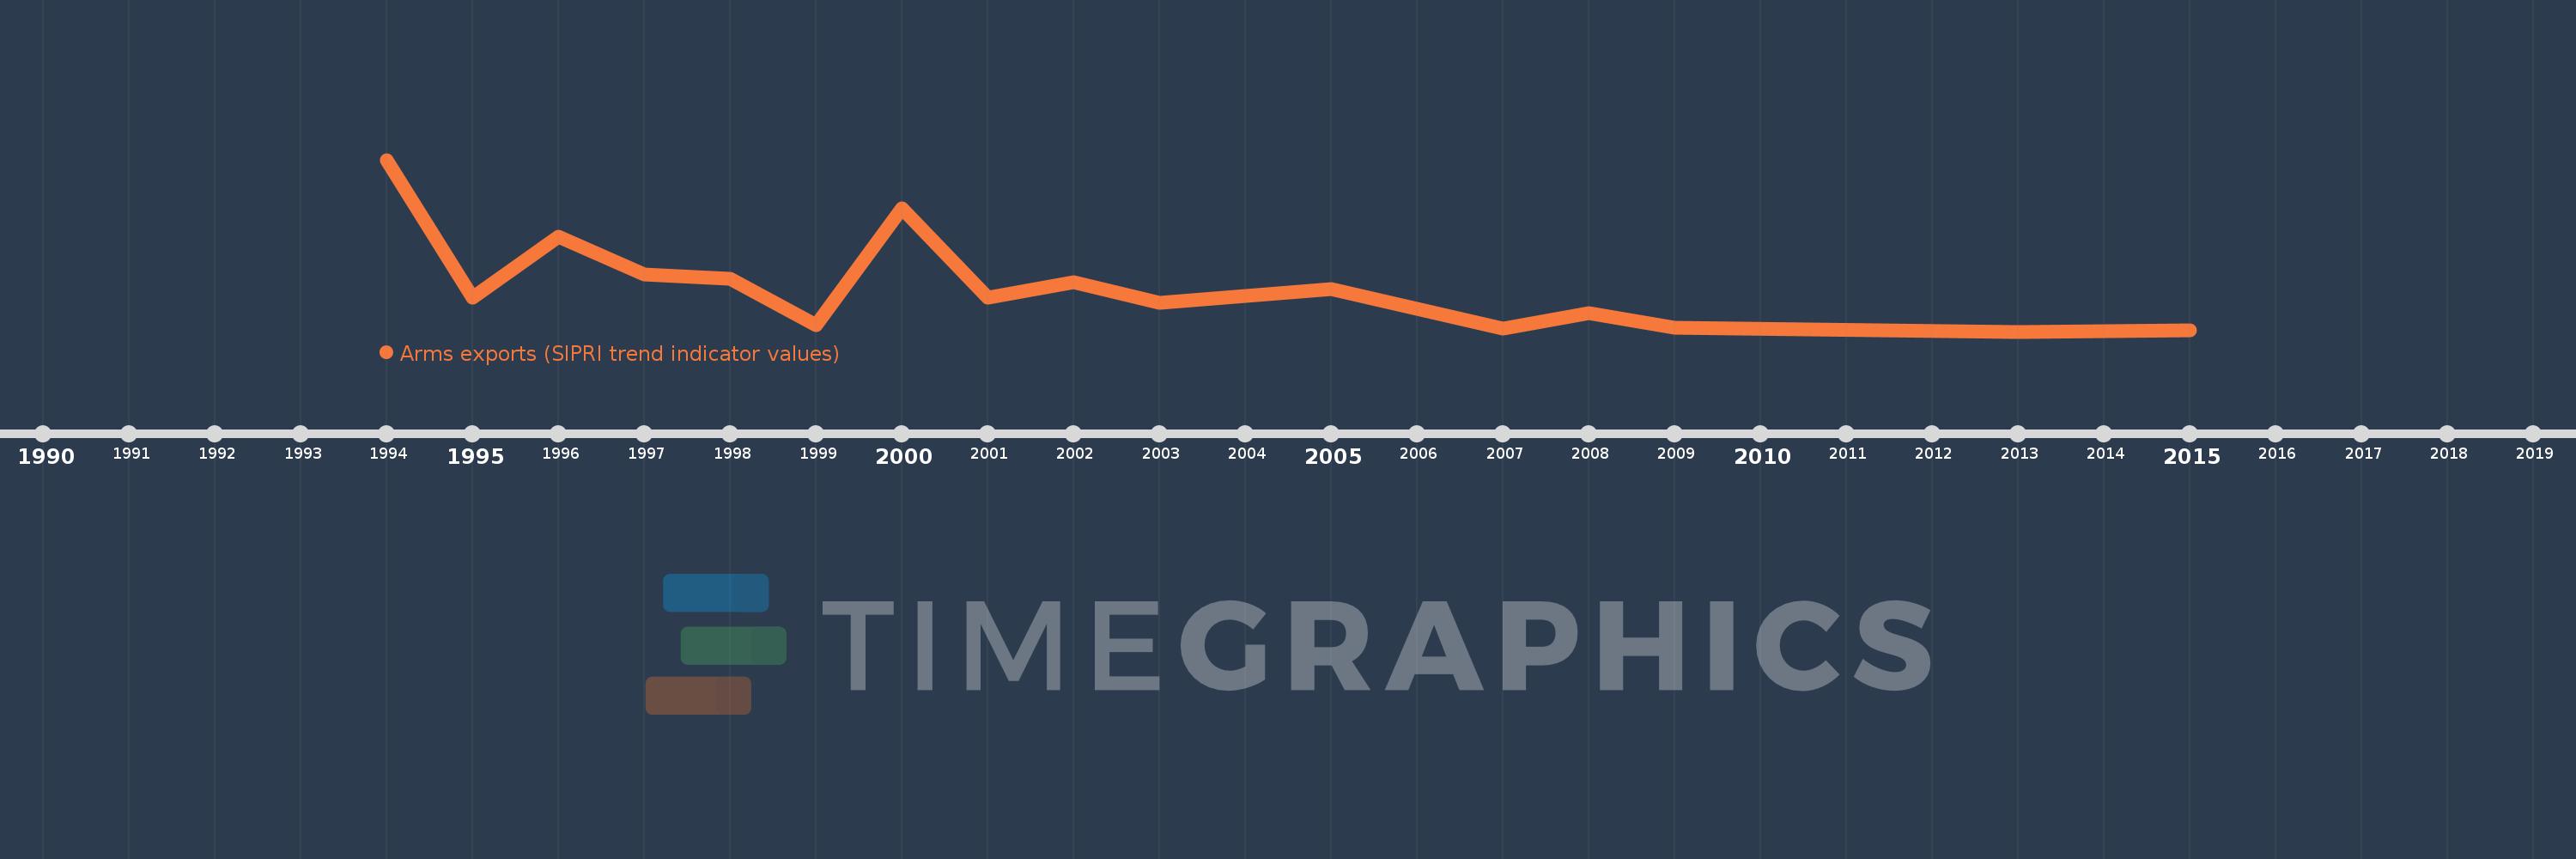
Cette échelle de temps montre un graphique de 1994 année à 2015 année Slovak Republic. Les données jusqu'à 1993 année ne sont pas présentés. Quantité d'observations actuelles selon dates: 16.
Source (désignation):
Les indicateurs du développement mondiale
Source (organisation):
Stockholm International Peace Research Institute (SIPRI), Arms Transfers Programme (http://portal.sipri.org/publications/pages/transfer/splash).
Catégories:
Public Sector, Trade
Dernière mise à jour
23 avr. 2017
Les indicateurs de changement de valeurs selon les années
En moyenne:
48.25 mln.
Minimum:
4.0 mln.
1 janv. 2013
Maximum:
173.0 mln.
1 janv. 1994
Pour la date d''observation
Valeur
Changement absolu
Le changement par rapport à la valeur précédente
1 janv. 1994
173.0 mln.
+173.0 mln.
0.0%
1 janv. 1995
37.0 mln.
-136.0 mln.
-78.61%
1 janv. 1996
97.0 mln.
+60.0 mln.
162.16%
1 janv. 1997
60.0 mln.
-37.0 mln.
-38.14%
1 janv. 1998
56.0 mln.
-4.0 mln.
-6.67%
1 janv. 1999
10.0 mln.
-46.0 mln.
-82.14%
1 janv. 2000
125.0 mln.
+115.0 mln.
1.15 milles%
1 janv. 2001
37.0 mln.
-88.0 mln.
-70.4%
1 janv. 2002
53.0 mln.
+16.0 mln.
43.24%
1 janv. 2003
32.0 mln.
-21.0 mln.
-39.62%
1 janv. 2005
46.0 mln.
+14.0 mln.
43.75%
1 janv. 2007
7.0 mln.
-39.0 mln.
-84.78%
1 janv. 2008
22.0 mln.
+15.0 mln.
214.29%
1 janv. 2009
8.0 mln.
-14.0 mln.
-63.64%
1 janv. 2013
4.0 mln.
-4.0 mln.
-50.0%
1 janv. 2015
5.0 mln.
+1000.0 milles
25.0%
Classement des pays selon les statistiques actuelles par années

Commentaires:

Envoyer
PremiumAbout & FeedbackUn accordConfidentialité
logo
© 2022 Selected Technologies LLC – Morgan Hill, California