33
/fr/
AIzaSyB4mHJ5NPEv-XzF7P6NDYXjlkCWaeKw5bc
November 1, 2025
183538
Macedonia, FYR
MKD
true
2
1
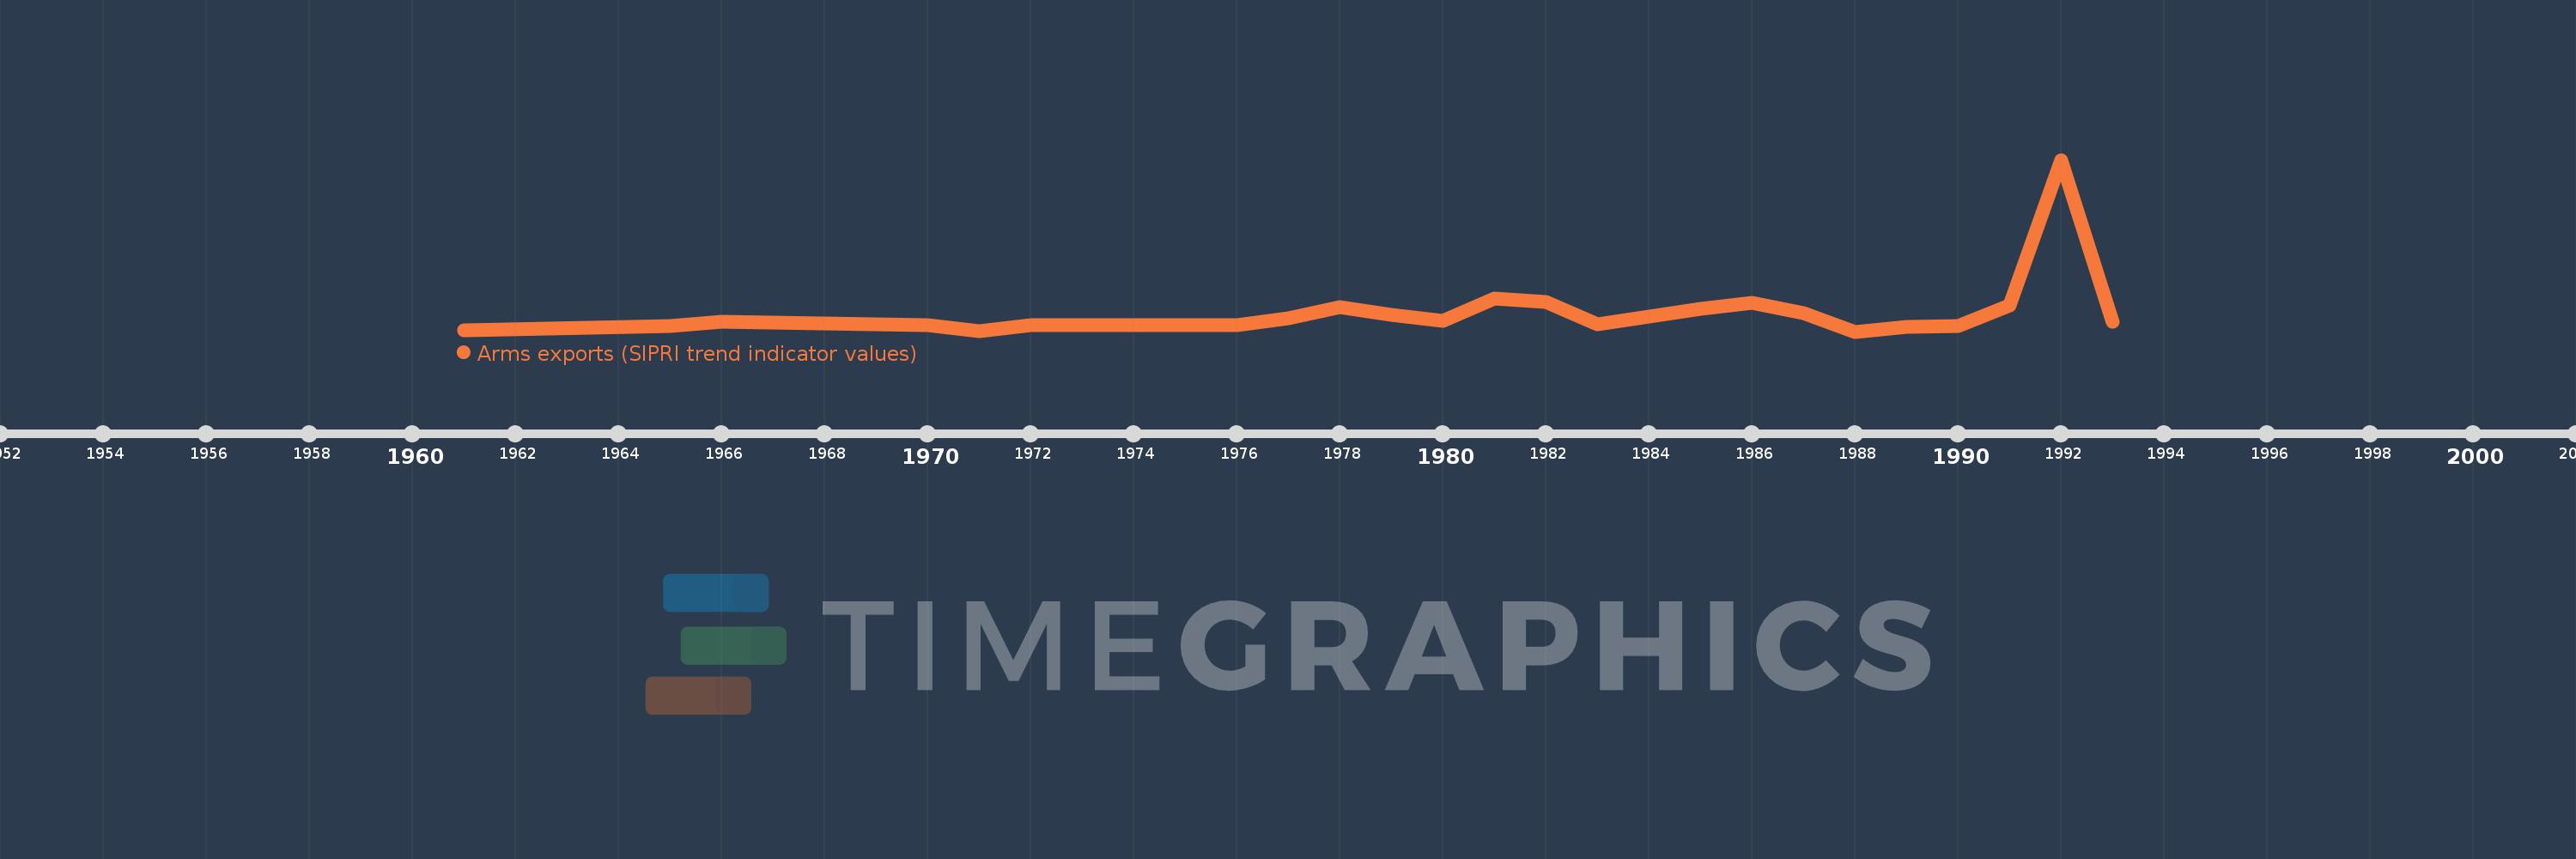
Arms exports (SIPRI trend indicator values)
1993,1992,1991,1990,1989,1988,1987,1986,1985,1984,1983,1982,1981,1980,1979,1978,1977,1976,1974,1972,1971,1970,1966,1965,1961