29
/fr/
fr
AIzaSyAYiBZKx7MnpbEhh9jyipgxe19OcubqV5w
April 1, 2024
258022
Syrian Arab Republic
SYR
true
2
1
Arms exports (SIPRI trend indicator values)
2011,2010,2007,1998,1997,1994,1993,1989,1987,1986,1985,1984,1983,1978,1976,1975,1971
Download
Bibliothèque de statistiques globales →Syrian Arab Republic →

Arms exports (SIPRI trend indicator values)

Cette statistique dans les autres pays:
AfghanistanAlbaniaAlgeriaAngolaArab WorldArgentinaArubaAustraliaAustriaBahamas, TheBahrainBangladeshBelarusBelgiumBosnia and HerzegovinaBotswanaBrazilBrunei DarussalamBulgariaCambodiaCanadaCentral Europe and the BalticsChadChileChinaColombiaCongo, Dem. Rep.Costa RicaCote d'IvoireCroatiaCubaCyprusCzech RepublicDenmarkEarly-demographic dividendEast Asia & PacificEast Asia & Pacific (excluding high income)East Asia & Pacific (IDA & IBRD countries)EcuadorEgypt, Arab Rep.El SalvadorEritreaEstoniaEthiopiaEuro areaEurope & Central AsiaEurope & Central Asia (excluding high income)Europe & Central Asia (IDA & IBRD countries)European UnionFijiFinlandFragile and conflict affected situationsFranceGabonGeorgiaGermanyGhanaGreeceGuyanaHeavily indebted poor countries (HIPC)High incomeHungaryIBRD onlyIcelandIDA & IBRD totalIDA blendIDA onlyIDA totalIndiaIndonesiaIran, Islamic Rep.IraqIrelandIsraelItalyJapanJordanKazakhstanKenyaKorea, Dem. People’s Rep.Korea, Rep.KuwaitKyrgyz RepublicLate-demographic dividendLatin America & Caribbean Latin America & Caribbean (excluding high income)Latin America & the Caribbean (IDA & IBRD countries)LatviaLeast developed countries: UN classificationLebanonLibyaLithuaniaLow & middle incomeLow incomeLower middle incomeLuxembourgMacedonia, FYRMalawiMalaysiaMaltaMiddle East & North AfricaMiddle East & North Africa (excluding high income)Middle East & North Africa (IDA & IBRD countries)Middle incomeMoldovaMontenegroMoroccoMozambiqueNetherlandsNew ZealandNicaraguaNigerNigeriaNorth AmericaNorwayOECD membersOmanPakistanPanamaPeruPhilippinesPolandPortugalPost-demographic dividendPre-demographic dividendQatarRomaniaRussian FederationSaudi ArabiaSenegalSerbiaSeychellesSingaporeSlovak RepublicSouth AfricaSouth AsiaSouth Asia (IDA & IBRD)SpainSri LankaSub-Saharan Africa Sub-Saharan Africa (excluding high income)Sub-Saharan Africa (IDA & IBRD countries)SudanSwedenSwitzerlandSyrian Arab RepublicThailandTurkeyUgandaUkraineUnited Arab EmiratesUnited KingdomUnited StatesUpper middle incomeUruguayUzbekistanVenezuela, RBVietnamYemen, Rep.ZambiaZimbabwe
La ligne de temps
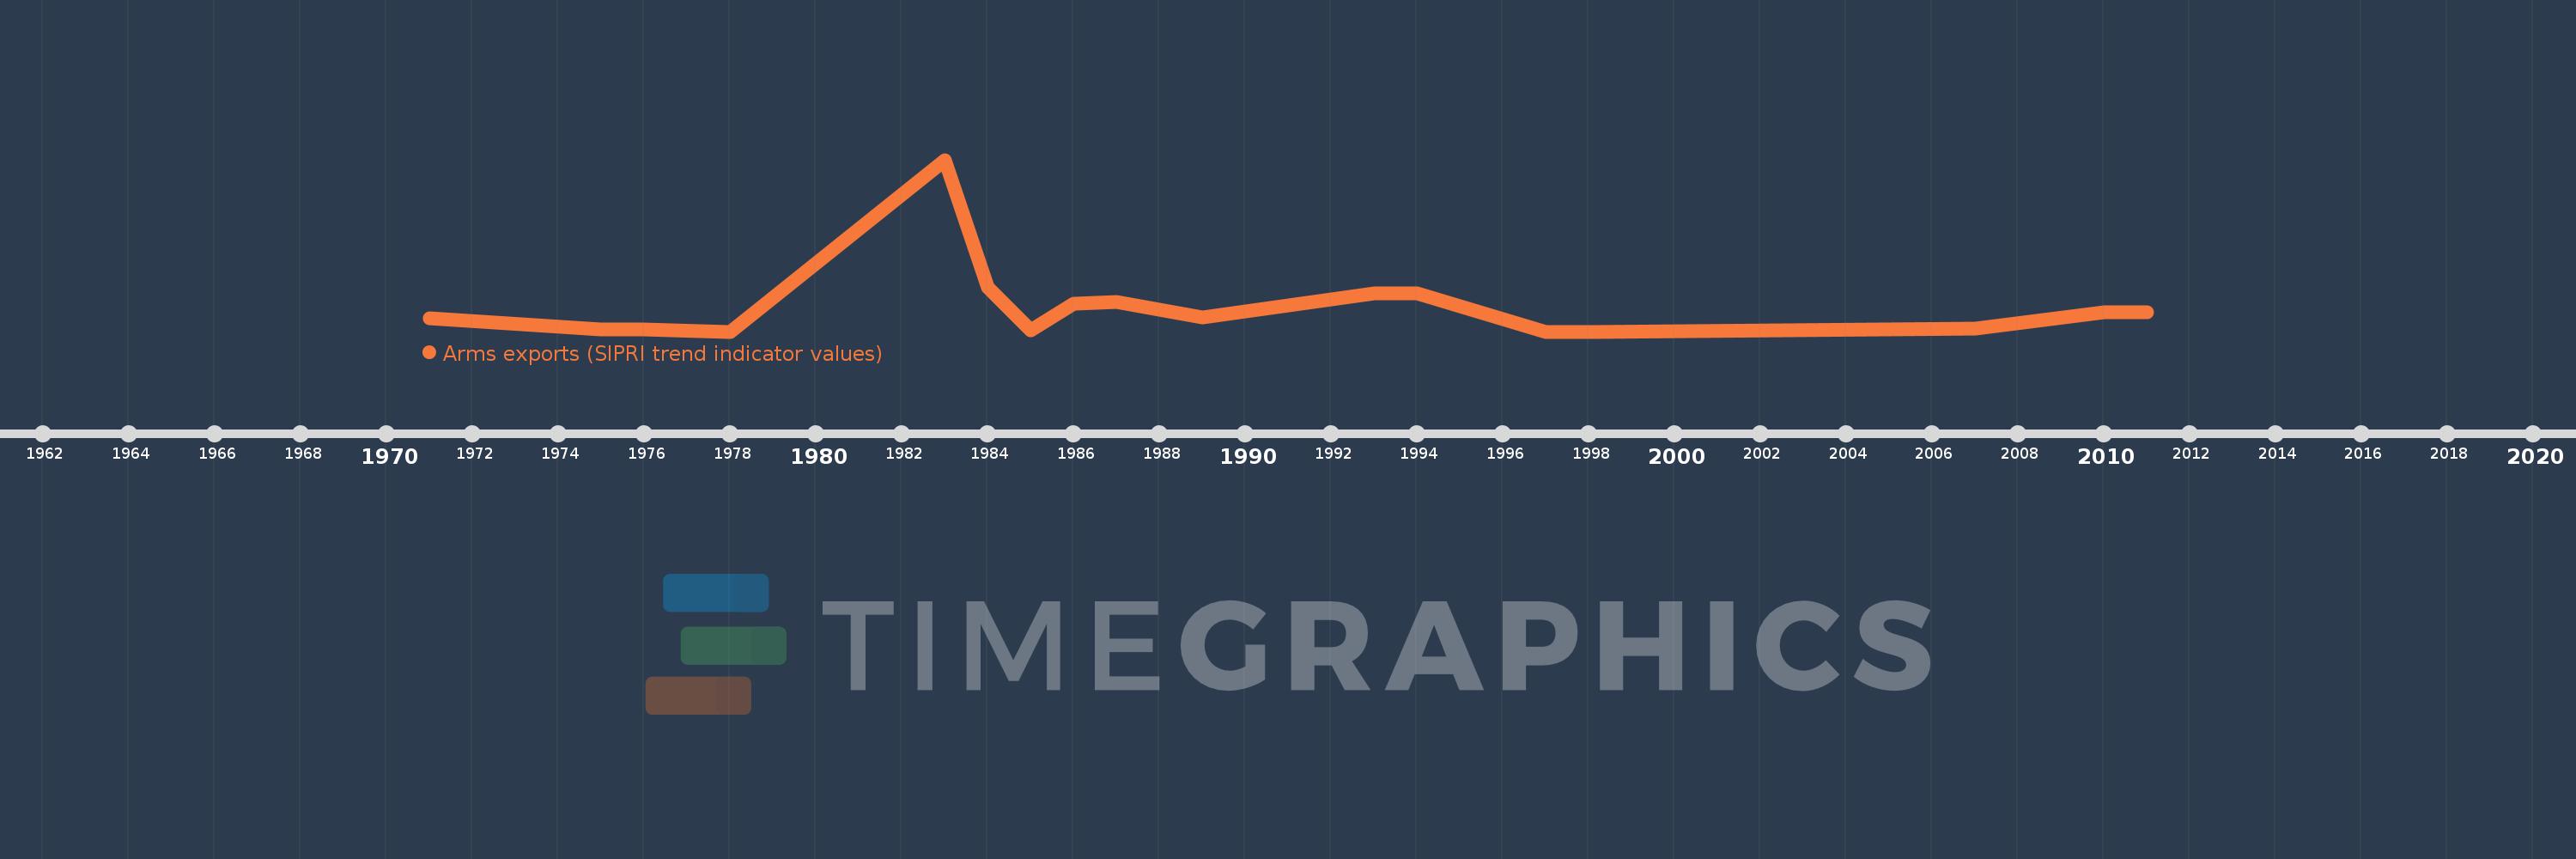
Cette échelle de temps montre un graphique de 1971 année à 2011 année Syrian Arab Republic. Les données jusqu'à 1970 année ne sont pas présentés. Quantité d'observations actuelles selon dates: 17.
Source (désignation):
Les indicateurs du développement mondiale
Source (organisation):
Stockholm International Peace Research Institute (SIPRI), Arms Transfers Programme (http://portal.sipri.org/publications/pages/transfer/splash).
Catégories:
Public Sector, Trade
Dernière mise à jour
23 avr. 2017
Les indicateurs de changement de valeurs selon les années
En moyenne:
25.941 mln.
Minimum:
0.0
1 janv. 1978
Maximum:
178.0 mln.
1 janv. 1983
Pour la date d''observation
Valeur
Changement absolu
Le changement par rapport à la valeur précédente
1 janv. 1971
14.0 mln.
+14.0 mln.
0.0%
1 janv. 1975
2.0 mln.
-12.0 mln.
-85.71%
1 janv. 1976
2.0 mln.
0.0
0.0%
1 janv. 1978
0.0
-2.0 mln.
-100.0%
1 janv. 1983
178.0 mln.
+178.0 mln.
%
1 janv. 1984
46.0 mln.
-132.0 mln.
-74.16%
1 janv. 1985
1000.0 milles
-45.0 mln.
-97.83%
1 janv. 1986
29.0 mln.
+28.0 mln.
2.8 milles%
1 janv. 1987
31.0 mln.
+2.0 mln.
6.9%
1 janv. 1989
15.0 mln.
-16.0 mln.
-51.61%
1 janv. 1993
40.0 mln.
+25.0 mln.
166.67%
1 janv. 1994
40.0 mln.
0.0
0.0%
1 janv. 1997
0.0
-40.0 mln.
-100.0%
1 janv. 1998
0.0
0.0
%
1 janv. 2007
3.0 mln.
+3.0 mln.
%
1 janv. 2010
20.0 mln.
+17.0 mln.
566.67%
1 janv. 2011
20.0 mln.
0.0
0.0%
Classement des pays selon les statistiques actuelles par années

Commentaires:

Envoyer
PremiumAbout & FeedbackUn accordConfidentialité
logo
© 2022 Selected Technologies LLC – Morgan Hill, California