33
/fr/
AIzaSyAYiBZKx7MnpbEhh9jyipgxe19OcubqV5w
May 1, 2025
159168
Ireland
IRL
true
2
1
Arms exports (SIPRI trend indicator values)
2015,2014,2013,2012,2011,2010,2009,2008,2007,2006,1982,1981,1980,1979
Download
Bibliothèque de statistiques globales →Ireland →

Arms exports (SIPRI trend indicator values)

Cette statistique dans les autres pays:

AfghanistanAlbaniaAlgeriaAngolaArab WorldArgentinaArubaAustraliaAustriaBahamas, TheBahrainBangladeshBelarusBelgiumBosnia and HerzegovinaBotswanaBrazilBrunei DarussalamBulgariaCambodiaCanadaCentral Europe and the BalticsChadChileChinaColombiaCongo, Dem. Rep.Costa RicaCote d'IvoireCroatiaCubaCyprusCzech RepublicDenmarkEarly-demographic dividendEast Asia & PacificEast Asia & Pacific (excluding high income)East Asia & Pacific (IDA & IBRD countries)EcuadorEgypt, Arab Rep.El SalvadorEritreaEstoniaEthiopiaEuro areaEurope & Central AsiaEurope & Central Asia (excluding high income)Europe & Central Asia (IDA & IBRD countries)European UnionFijiFinlandFragile and conflict affected situationsFranceGabonGeorgiaGermanyGhanaGreeceGuyanaHeavily indebted poor countries (HIPC)High incomeHungaryIBRD onlyIcelandIDA & IBRD totalIDA blendIDA onlyIDA totalIndiaIndonesiaIran, Islamic Rep.IraqIrelandIsraelItalyJapanJordanKazakhstanKenyaKorea, Dem. People’s Rep.Korea, Rep.KuwaitKyrgyz RepublicLate-demographic dividendLatin America & Caribbean Latin America & Caribbean (excluding high income)Latin America & the Caribbean (IDA & IBRD countries)LatviaLeast developed countries: UN classificationLebanonLibyaLithuaniaLow & middle incomeLow incomeLower middle incomeLuxembourgMacedonia, FYRMalawiMalaysiaMaltaMiddle East & North AfricaMiddle East & North Africa (excluding high income)Middle East & North Africa (IDA & IBRD countries)Middle incomeMoldovaMontenegroMoroccoMozambiqueNetherlandsNew ZealandNicaraguaNigerNigeriaNorth AmericaNorwayOECD membersOmanPakistanPanamaPeruPhilippinesPolandPortugalPost-demographic dividendPre-demographic dividendQatarRomaniaRussian FederationSaudi ArabiaSenegalSerbiaSeychellesSingaporeSlovak RepublicSouth AfricaSouth AsiaSouth Asia (IDA & IBRD)SpainSri LankaSub-Saharan Africa Sub-Saharan Africa (excluding high income)Sub-Saharan Africa (IDA & IBRD countries)SudanSwedenSwitzerlandSyrian Arab RepublicThailandTurkeyUgandaUkraineUnited Arab EmiratesUnited KingdomUnited StatesUpper middle incomeUruguayUzbekistanVenezuela, RBVietnamYemen, Rep.ZambiaZimbabwe

La ligne de temps

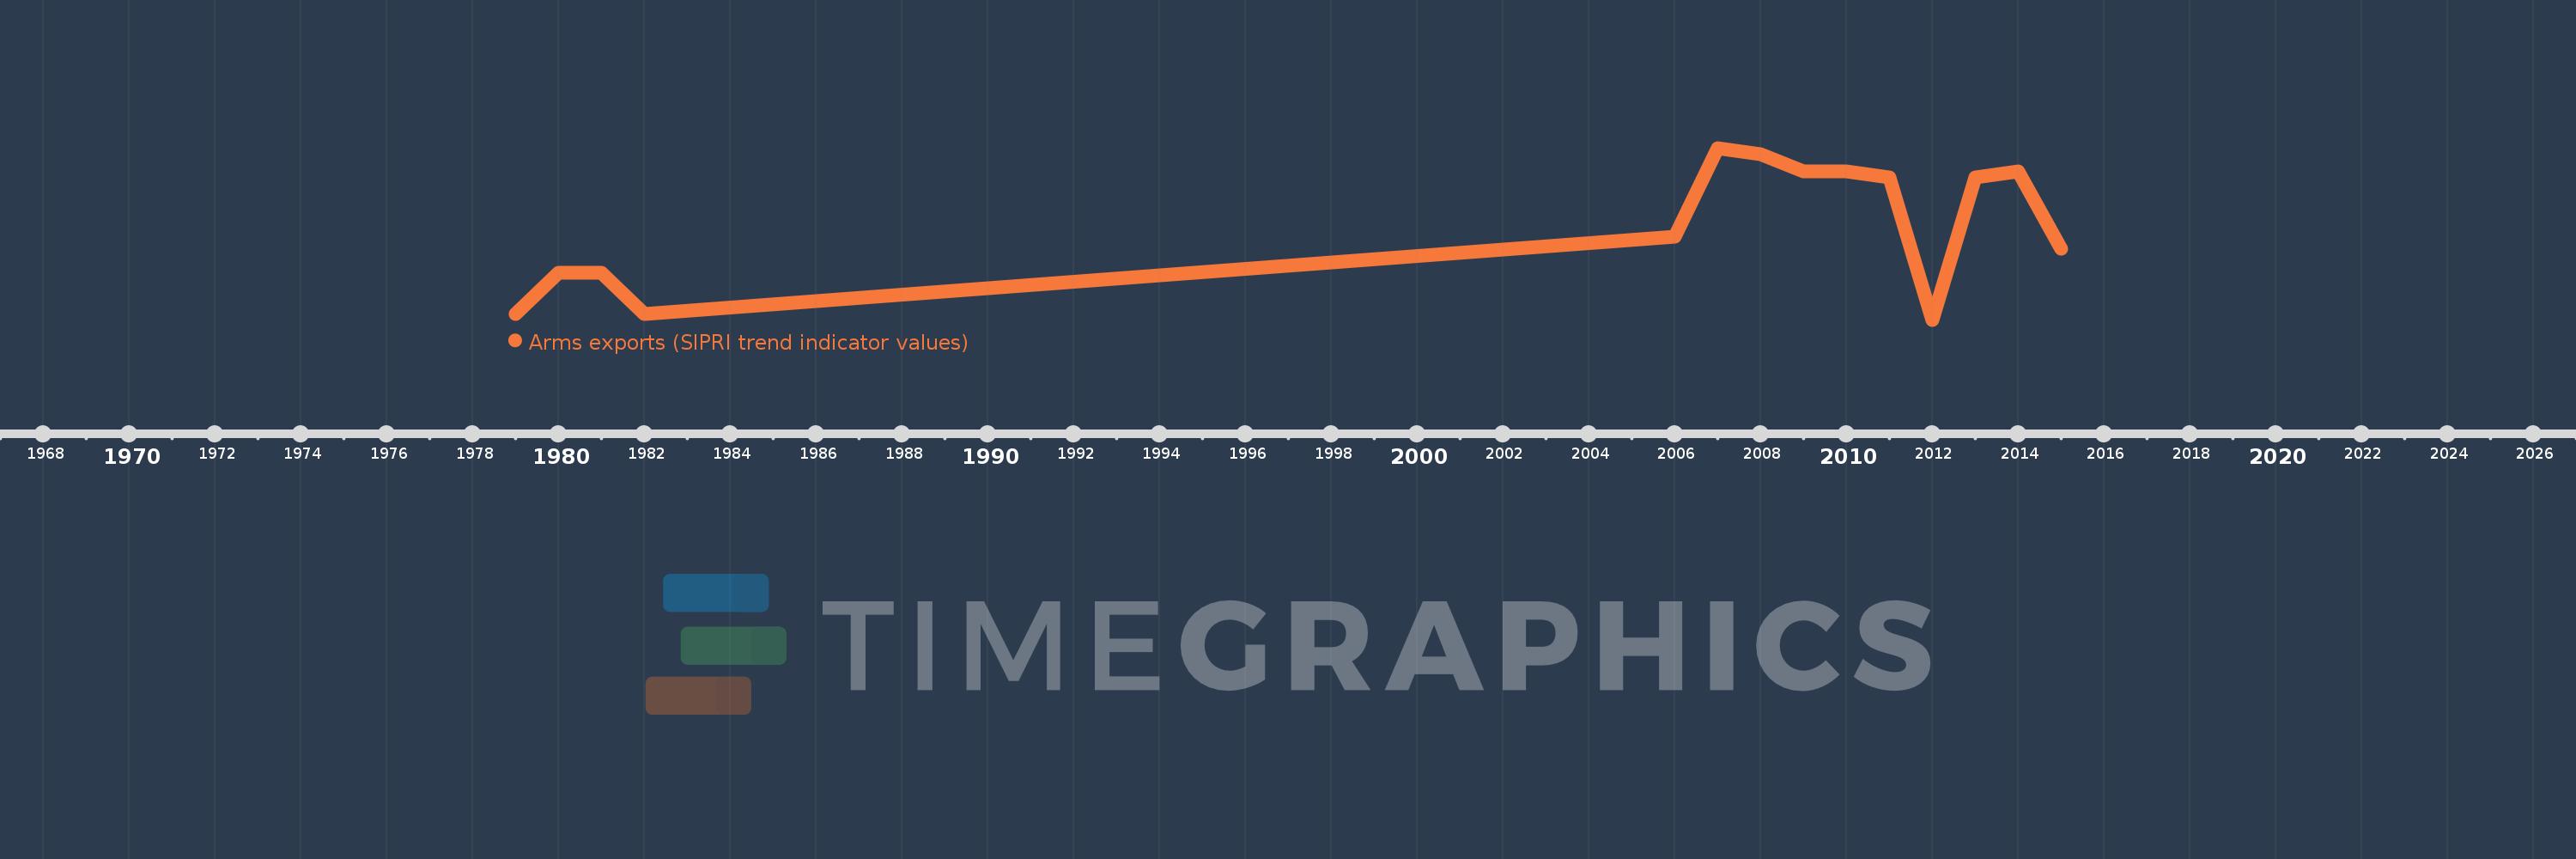
Cette échelle de temps montre un graphique de 1979 année à 2015 année Ireland. Les données jusqu'à 1978 année ne sont pas présentés. Quantité d'observations actuelles selon dates: 14.

Source (désignation):

Les indicateurs du développement mondiale

Source (organisation):

Stockholm International Peace Research Institute (SIPRI), Arms Transfers Programme (http://portal.sipri.org/publications/pages/transfer/splash).

Catégories:

Public Sector, Trade

Dernière mise à jour

23 avr. 2017

Les indicateurs de changement de valeurs selon les années

En moyenne:
17.0 mln.
Minimum:
1000.0 milles
1 janv. 2012
Maximum:
30.0 mln.
1 janv. 2007
Pour la date d''observation
Valeur
Changement absolu
Le changement par rapport à la valeur précédente
1 janv. 1979
2.0 mln.
+2.0 mln.
0.0%
1 janv. 1980
9.0 mln.
+7.0 mln.
350.0%
1 janv. 1981
9.0 mln.
0.0
0.0%
1 janv. 1982
2.0 mln.
-7.0 mln.
-77.78%
1 janv. 2006
15.0 mln.
+13.0 mln.
650.0%
1 janv. 2007
30.0 mln.
+15.0 mln.
100.0%
1 janv. 2008
29.0 mln.
-1000.0 milles
-3.33%
1 janv. 2009
26.0 mln.
-3.0 mln.
-10.34%
1 janv. 2010
26.0 mln.
0.0
0.0%
1 janv. 2011
25.0 mln.
-1000.0 milles
-3.85%
1 janv. 2012
1000.0 milles
-24.0 mln.
-96.0%
1 janv. 2013
25.0 mln.
+24.0 mln.
2.4 milles%
1 janv. 2014
26.0 mln.
+1000.0 milles
4.0%
1 janv. 2015
13.0 mln.
-13.0 mln.
-50.0%

Classement des pays selon les statistiques actuelles par années