33
/fr/
AIzaSyAYiBZKx7MnpbEhh9jyipgxe19OcubqV5w
August 1, 2025
274548
United Arab Emirates
ARE
true
2
1
Arms exports (SIPRI trend indicator values)
2016,2015,2014,2012,2011,2010,2009,2008,2007,2006,2005,1998,1997,1996,1991,1988,1984,1975
Download
Bibliothèque de statistiques globales →United Arab Emirates →

Arms exports (SIPRI trend indicator values)

Cette statistique dans les autres pays:

AfghanistanAlbaniaAlgeriaAngolaArab WorldArgentinaArubaAustraliaAustriaBahamas, TheBahrainBangladeshBelarusBelgiumBosnia and HerzegovinaBotswanaBrazilBrunei DarussalamBulgariaCambodiaCanadaCentral Europe and the BalticsChadChileChinaColombiaCongo, Dem. Rep.Costa RicaCote d'IvoireCroatiaCubaCyprusCzech RepublicDenmarkEarly-demographic dividendEast Asia & PacificEast Asia & Pacific (excluding high income)East Asia & Pacific (IDA & IBRD countries)EcuadorEgypt, Arab Rep.El SalvadorEritreaEstoniaEthiopiaEuro areaEurope & Central AsiaEurope & Central Asia (excluding high income)Europe & Central Asia (IDA & IBRD countries)European UnionFijiFinlandFragile and conflict affected situationsFranceGabonGeorgiaGermanyGhanaGreeceGuyanaHeavily indebted poor countries (HIPC)High incomeHungaryIBRD onlyIcelandIDA & IBRD totalIDA blendIDA onlyIDA totalIndiaIndonesiaIran, Islamic Rep.IraqIrelandIsraelItalyJapanJordanKazakhstanKenyaKorea, Dem. People’s Rep.Korea, Rep.KuwaitKyrgyz RepublicLate-demographic dividendLatin America & Caribbean Latin America & Caribbean (excluding high income)Latin America & the Caribbean (IDA & IBRD countries)LatviaLeast developed countries: UN classificationLebanonLibyaLithuaniaLow & middle incomeLow incomeLower middle incomeLuxembourgMacedonia, FYRMalawiMalaysiaMaltaMiddle East & North AfricaMiddle East & North Africa (excluding high income)Middle East & North Africa (IDA & IBRD countries)Middle incomeMoldovaMontenegroMoroccoMozambiqueNetherlandsNew ZealandNicaraguaNigerNigeriaNorth AmericaNorwayOECD membersOmanPakistanPanamaPeruPhilippinesPolandPortugalPost-demographic dividendPre-demographic dividendQatarRomaniaRussian FederationSaudi ArabiaSenegalSerbiaSeychellesSingaporeSlovak RepublicSouth AfricaSouth AsiaSouth Asia (IDA & IBRD)SpainSri LankaSub-Saharan Africa Sub-Saharan Africa (excluding high income)Sub-Saharan Africa (IDA & IBRD countries)SudanSwedenSwitzerlandSyrian Arab RepublicThailandTurkeyUgandaUkraineUnited Arab EmiratesUnited KingdomUnited StatesUpper middle incomeUruguayUzbekistanVenezuela, RBVietnamYemen, Rep.ZambiaZimbabwe

La ligne de temps

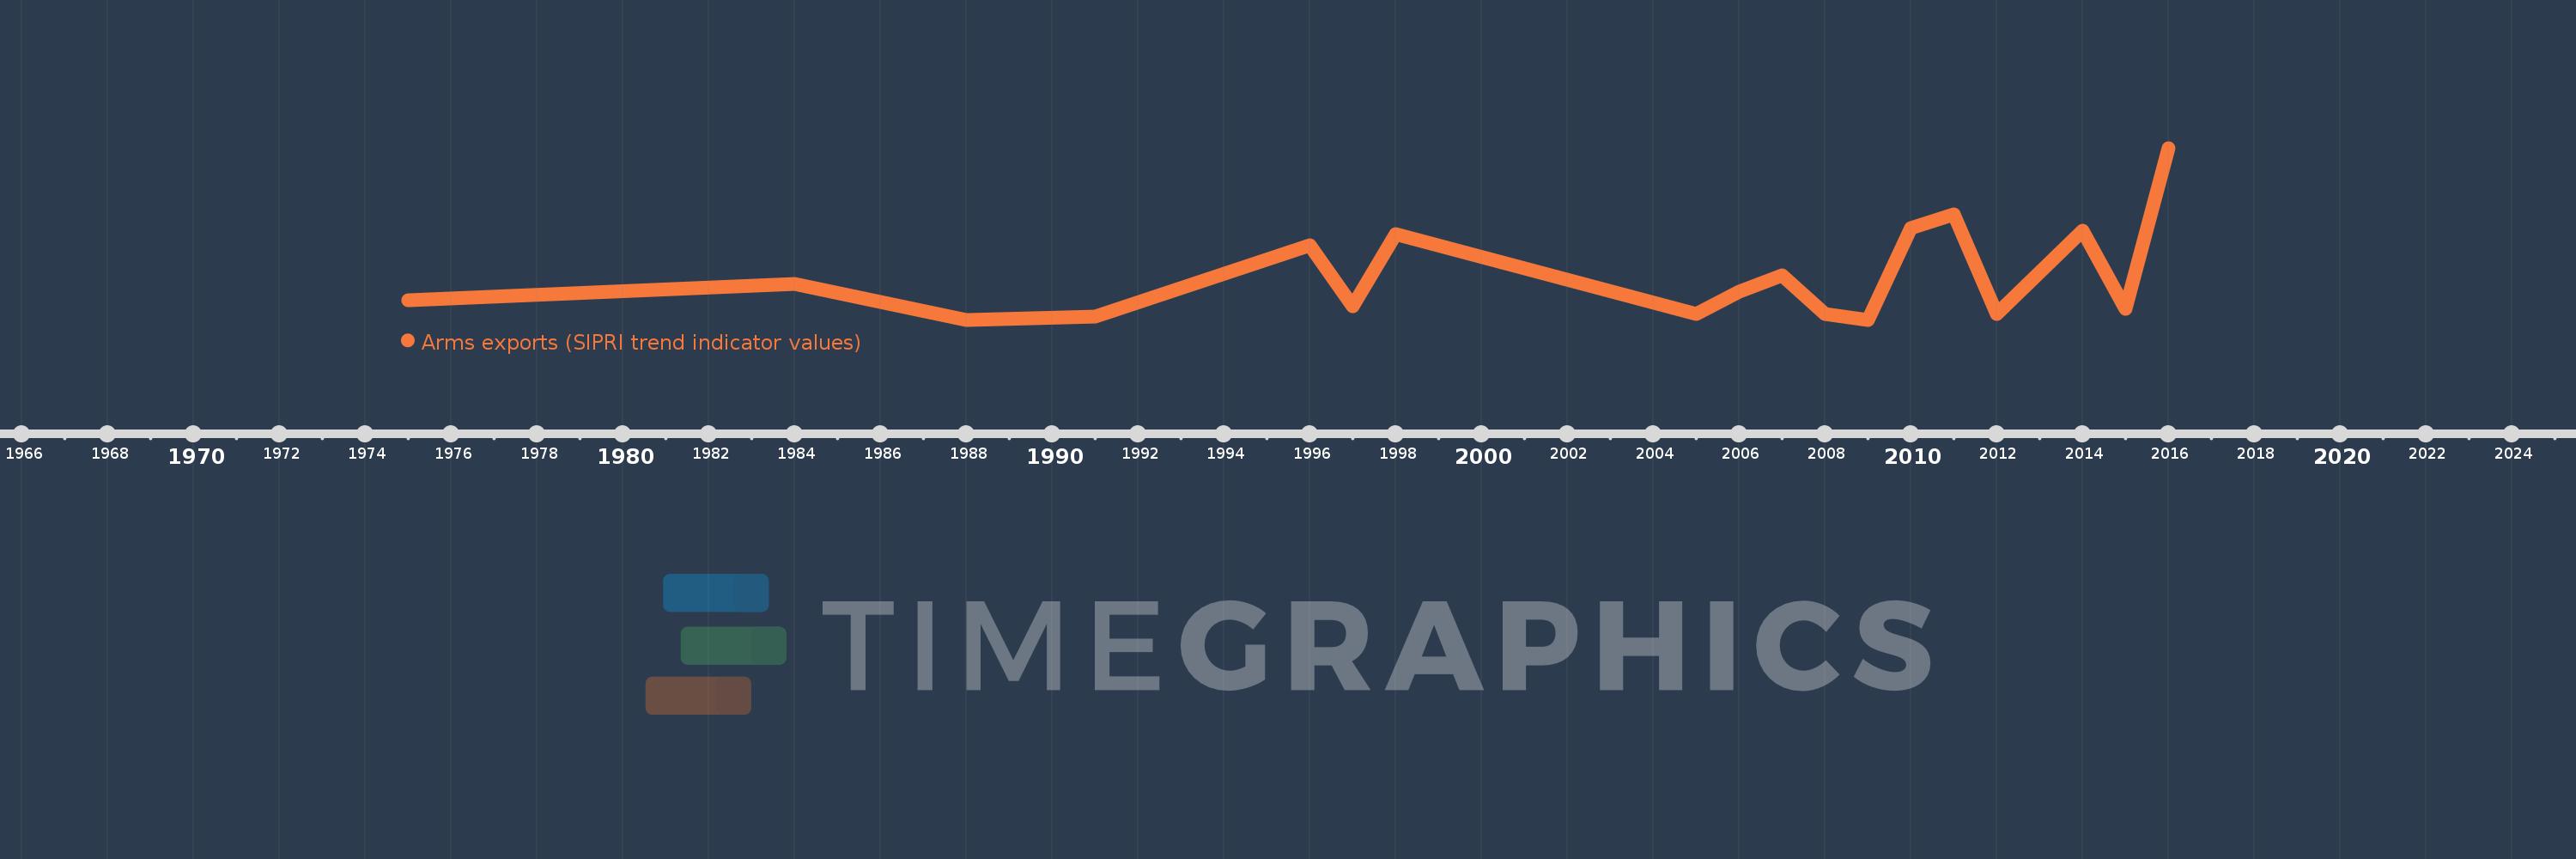
Cette échelle de temps montre un graphique de 1975 année à 2016 année United Arab Emirates. Les données jusqu'à 1974 année ne sont pas présentés. Quantité d'observations actuelles selon dates: 18.

Source (désignation):

Les indicateurs du développement mondiale

Source (organisation):

Stockholm International Peace Research Institute (SIPRI), Arms Transfers Programme (http://portal.sipri.org/publications/pages/transfer/splash).

Catégories:

Public Sector, Trade

Dernière mise à jour

23 avr. 2017

Les indicateurs de changement de valeurs selon les années

En moyenne:
16.833 mln.
Minimum:
1000.0 milles
1 janv. 1988
Maximum:
63.0 mln.
1 janv. 2016
Pour la date d''observation
Valeur
Changement absolu
Le changement par rapport à la valeur précédente
1 janv. 1975
8.0 mln.
+8.0 mln.
0.0%
1 janv. 1984
14.0 mln.
+6.0 mln.
75.0%
1 janv. 1988
1000.0 milles
-13.0 mln.
-92.86%
1 janv. 1991
2.0 mln.
+1000.0 milles
100.0%
1 janv. 1996
28.0 mln.
+26.0 mln.
1.3 milles%
1 janv. 1997
6.0 mln.
-22.0 mln.
-78.57%
1 janv. 1998
32.0 mln.
+26.0 mln.
433.33%
1 janv. 2005
3.0 mln.
-29.0 mln.
-90.63%
1 janv. 2006
11.0 mln.
+8.0 mln.
266.67%
1 janv. 2007
17.0 mln.
+6.0 mln.
54.55%
1 janv. 2008
3.0 mln.
-14.0 mln.
-82.35%
1 janv. 2009
1000.0 milles
-2.0 mln.
-66.67%
1 janv. 2010
34.0 mln.
+33.0 mln.
3.3 milles%
1 janv. 2011
39.0 mln.
+5.0 mln.
14.71%
1 janv. 2012
3.0 mln.
-36.0 mln.
-92.31%
1 janv. 2014
33.0 mln.
+30.0 mln.
1000.0%
1 janv. 2015
5.0 mln.
-28.0 mln.
-84.85%
1 janv. 2016
63.0 mln.
+58.0 mln.
1.16 milles%

Classement des pays selon les statistiques actuelles par années