33
/fr/
AIzaSyAYiBZKx7MnpbEhh9jyipgxe19OcubqV5w
August 1, 2025
164487
Jordan
JOR
true
2
1
Arms exports (SIPRI trend indicator values)
2016,2015,2014,2013,2011,2010,2009,2008,2006,2005,1998,1995,1990,1989,1987,1986,1984,1978,1976,1975,1974,1972
Download
Bibliothèque de statistiques globales →Jordan →

Arms exports (SIPRI trend indicator values)

Cette statistique dans les autres pays:

AfghanistanAlbaniaAlgeriaAngolaArab WorldArgentinaArubaAustraliaAustriaBahamas, TheBahrainBangladeshBelarusBelgiumBosnia and HerzegovinaBotswanaBrazilBrunei DarussalamBulgariaCambodiaCanadaCentral Europe and the BalticsChadChileChinaColombiaCongo, Dem. Rep.Costa RicaCote d'IvoireCroatiaCubaCyprusCzech RepublicDenmarkEarly-demographic dividendEast Asia & PacificEast Asia & Pacific (excluding high income)East Asia & Pacific (IDA & IBRD countries)EcuadorEgypt, Arab Rep.El SalvadorEritreaEstoniaEthiopiaEuro areaEurope & Central AsiaEurope & Central Asia (excluding high income)Europe & Central Asia (IDA & IBRD countries)European UnionFijiFinlandFragile and conflict affected situationsFranceGabonGeorgiaGermanyGhanaGreeceGuyanaHeavily indebted poor countries (HIPC)High incomeHungaryIBRD onlyIcelandIDA & IBRD totalIDA blendIDA onlyIDA totalIndiaIndonesiaIran, Islamic Rep.IraqIrelandIsraelItalyJapanJordanKazakhstanKenyaKorea, Dem. People’s Rep.Korea, Rep.KuwaitKyrgyz RepublicLate-demographic dividendLatin America & Caribbean Latin America & Caribbean (excluding high income)Latin America & the Caribbean (IDA & IBRD countries)LatviaLeast developed countries: UN classificationLebanonLibyaLithuaniaLow & middle incomeLow incomeLower middle incomeLuxembourgMacedonia, FYRMalawiMalaysiaMaltaMiddle East & North AfricaMiddle East & North Africa (excluding high income)Middle East & North Africa (IDA & IBRD countries)Middle incomeMoldovaMontenegroMoroccoMozambiqueNetherlandsNew ZealandNicaraguaNigerNigeriaNorth AmericaNorwayOECD membersOmanPakistanPanamaPeruPhilippinesPolandPortugalPost-demographic dividendPre-demographic dividendQatarRomaniaRussian FederationSaudi ArabiaSenegalSerbiaSeychellesSingaporeSlovak RepublicSouth AfricaSouth AsiaSouth Asia (IDA & IBRD)SpainSri LankaSub-Saharan Africa Sub-Saharan Africa (excluding high income)Sub-Saharan Africa (IDA & IBRD countries)SudanSwedenSwitzerlandSyrian Arab RepublicThailandTurkeyUgandaUkraineUnited Arab EmiratesUnited KingdomUnited StatesUpper middle incomeUruguayUzbekistanVenezuela, RBVietnamYemen, Rep.ZambiaZimbabwe

La ligne de temps

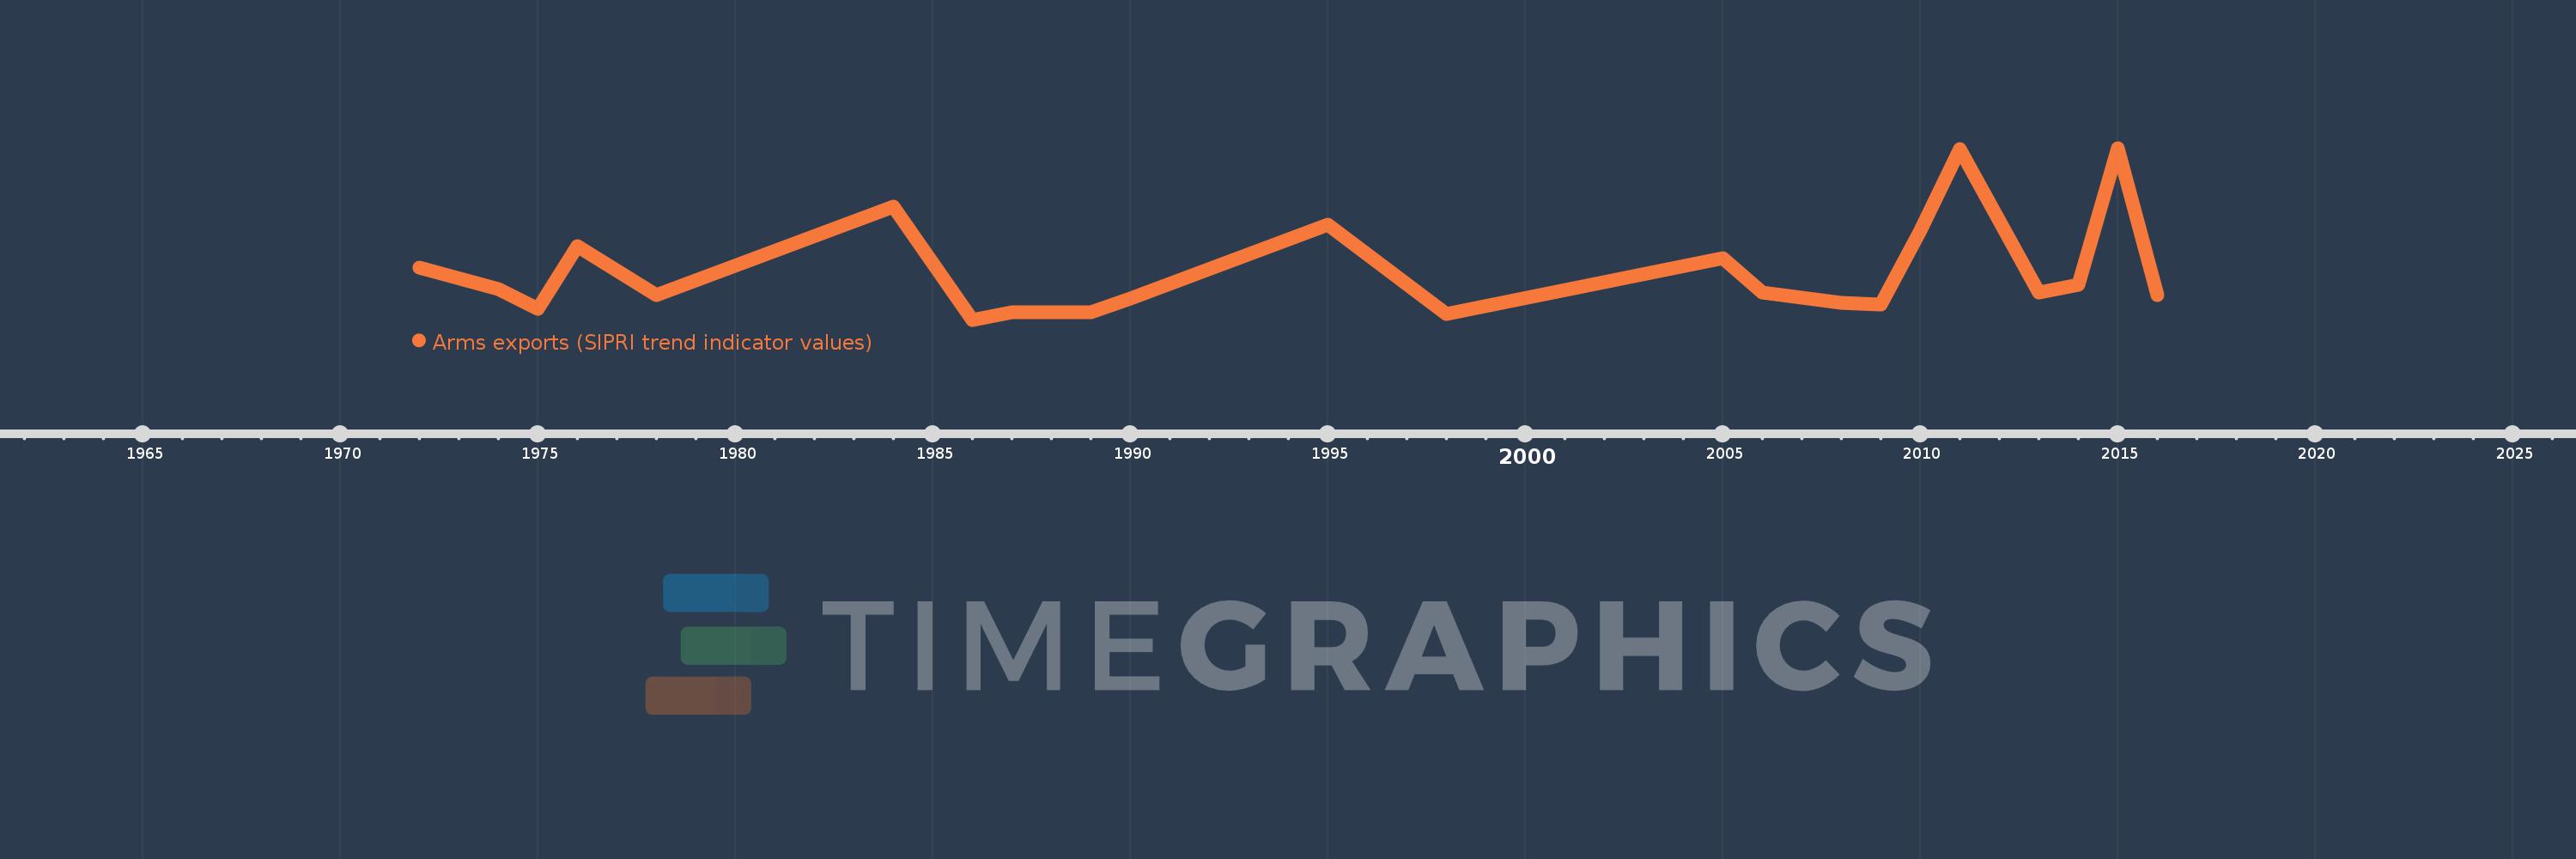
Cette échelle de temps montre un graphique de 1972 année à 2016 année Jordan. Les données jusqu'à 1971 année ne sont pas présentés. Quantité d'observations actuelles selon dates: 22.

Source (désignation):

Les indicateurs du développement mondiale

Source (organisation):

Stockholm International Peace Research Institute (SIPRI), Arms Transfers Programme (http://portal.sipri.org/publications/pages/transfer/splash).

Catégories:

Public Sector, Trade

Dernière mise à jour

23 avr. 2017

Les indicateurs de changement de valeurs selon les années

En moyenne:
34.091 mln.
Minimum:
2.0 mln.
1 janv. 1986
Maximum:
114.0 mln.
1 janv. 2015
Pour la date d''observation
Valeur
Changement absolu
Le changement par rapport à la valeur précédente
1 janv. 1972
36.0 mln.
+36.0 mln.
0.0%
1 janv. 1974
22.0 mln.
-14.0 mln.
-38.89%
1 janv. 1975
9.0 mln.
-13.0 mln.
-59.09%
1 janv. 1976
50.0 mln.
+41.0 mln.
455.56%
1 janv. 1978
18.0 mln.
-32.0 mln.
-64.0%
1 janv. 1984
76.0 mln.
+58.0 mln.
322.22%
1 janv. 1986
2.0 mln.
-74.0 mln.
-97.37%
1 janv. 1987
7.0 mln.
+5.0 mln.
250.0%
1 janv. 1989
7.0 mln.
0.0
0.0%
1 janv. 1990
16.0 mln.
+9.0 mln.
128.57%
1 janv. 1995
64.0 mln.
+48.0 mln.
300.0%
1 janv. 1998
6.0 mln.
-58.0 mln.
-90.63%
1 janv. 2005
42.0 mln.
+36.0 mln.
600.0%
1 janv. 2006
20.0 mln.
-22.0 mln.
-52.38%
1 janv. 2008
13.0 mln.
-7.0 mln.
-35.0%
1 janv. 2009
12.0 mln.
-1000.0 milles
-7.69%
1 janv. 2010
60.0 mln.
+48.0 mln.
400.0%
1 janv. 2011
113.0 mln.
+53.0 mln.
88.33%
1 janv. 2013
20.0 mln.
-93.0 mln.
-82.3%
1 janv. 2014
25.0 mln.
+5.0 mln.
25.0%
1 janv. 2015
114.0 mln.
+89.0 mln.
356.0%
1 janv. 2016
18.0 mln.
-96.0 mln.
-84.21%

Classement des pays selon les statistiques actuelles par années