33
/fr/
AIzaSyAYiBZKx7MnpbEhh9jyipgxe19OcubqV5w
August 1, 2025
225633
Portugal
PRT
true
2
1
Arms exports (SIPRI trend indicator values)
2016,2015,2013,2012,2010,2009,1994,1990,1988,1987,1984,1981,1980,1979,1977,1976,1975,1974,1972,1968
Download
Bibliothèque de statistiques globales →Portugal →

Arms exports (SIPRI trend indicator values)

Cette statistique dans les autres pays:

AfghanistanAlbaniaAlgeriaAngolaArab WorldArgentinaArubaAustraliaAustriaBahamas, TheBahrainBangladeshBelarusBelgiumBosnia and HerzegovinaBotswanaBrazilBrunei DarussalamBulgariaCambodiaCanadaCentral Europe and the BalticsChadChileChinaColombiaCongo, Dem. Rep.Costa RicaCote d'IvoireCroatiaCubaCyprusCzech RepublicDenmarkEarly-demographic dividendEast Asia & PacificEast Asia & Pacific (excluding high income)East Asia & Pacific (IDA & IBRD countries)EcuadorEgypt, Arab Rep.El SalvadorEritreaEstoniaEthiopiaEuro areaEurope & Central AsiaEurope & Central Asia (excluding high income)Europe & Central Asia (IDA & IBRD countries)European UnionFijiFinlandFragile and conflict affected situationsFranceGabonGeorgiaGermanyGhanaGreeceGuyanaHeavily indebted poor countries (HIPC)High incomeHungaryIBRD onlyIcelandIDA & IBRD totalIDA blendIDA onlyIDA totalIndiaIndonesiaIran, Islamic Rep.IraqIrelandIsraelItalyJapanJordanKazakhstanKenyaKorea, Dem. People’s Rep.Korea, Rep.KuwaitKyrgyz RepublicLate-demographic dividendLatin America & Caribbean Latin America & Caribbean (excluding high income)Latin America & the Caribbean (IDA & IBRD countries)LatviaLeast developed countries: UN classificationLebanonLibyaLithuaniaLow & middle incomeLow incomeLower middle incomeLuxembourgMacedonia, FYRMalawiMalaysiaMaltaMiddle East & North AfricaMiddle East & North Africa (excluding high income)Middle East & North Africa (IDA & IBRD countries)Middle incomeMoldovaMontenegroMoroccoMozambiqueNetherlandsNew ZealandNicaraguaNigerNigeriaNorth AmericaNorwayOECD membersOmanPakistanPanamaPeruPhilippinesPolandPortugalPost-demographic dividendPre-demographic dividendQatarRomaniaRussian FederationSaudi ArabiaSenegalSerbiaSeychellesSingaporeSlovak RepublicSouth AfricaSouth AsiaSouth Asia (IDA & IBRD)SpainSri LankaSub-Saharan Africa Sub-Saharan Africa (excluding high income)Sub-Saharan Africa (IDA & IBRD countries)SudanSwedenSwitzerlandSyrian Arab RepublicThailandTurkeyUgandaUkraineUnited Arab EmiratesUnited KingdomUnited StatesUpper middle incomeUruguayUzbekistanVenezuela, RBVietnamYemen, Rep.ZambiaZimbabwe

La ligne de temps

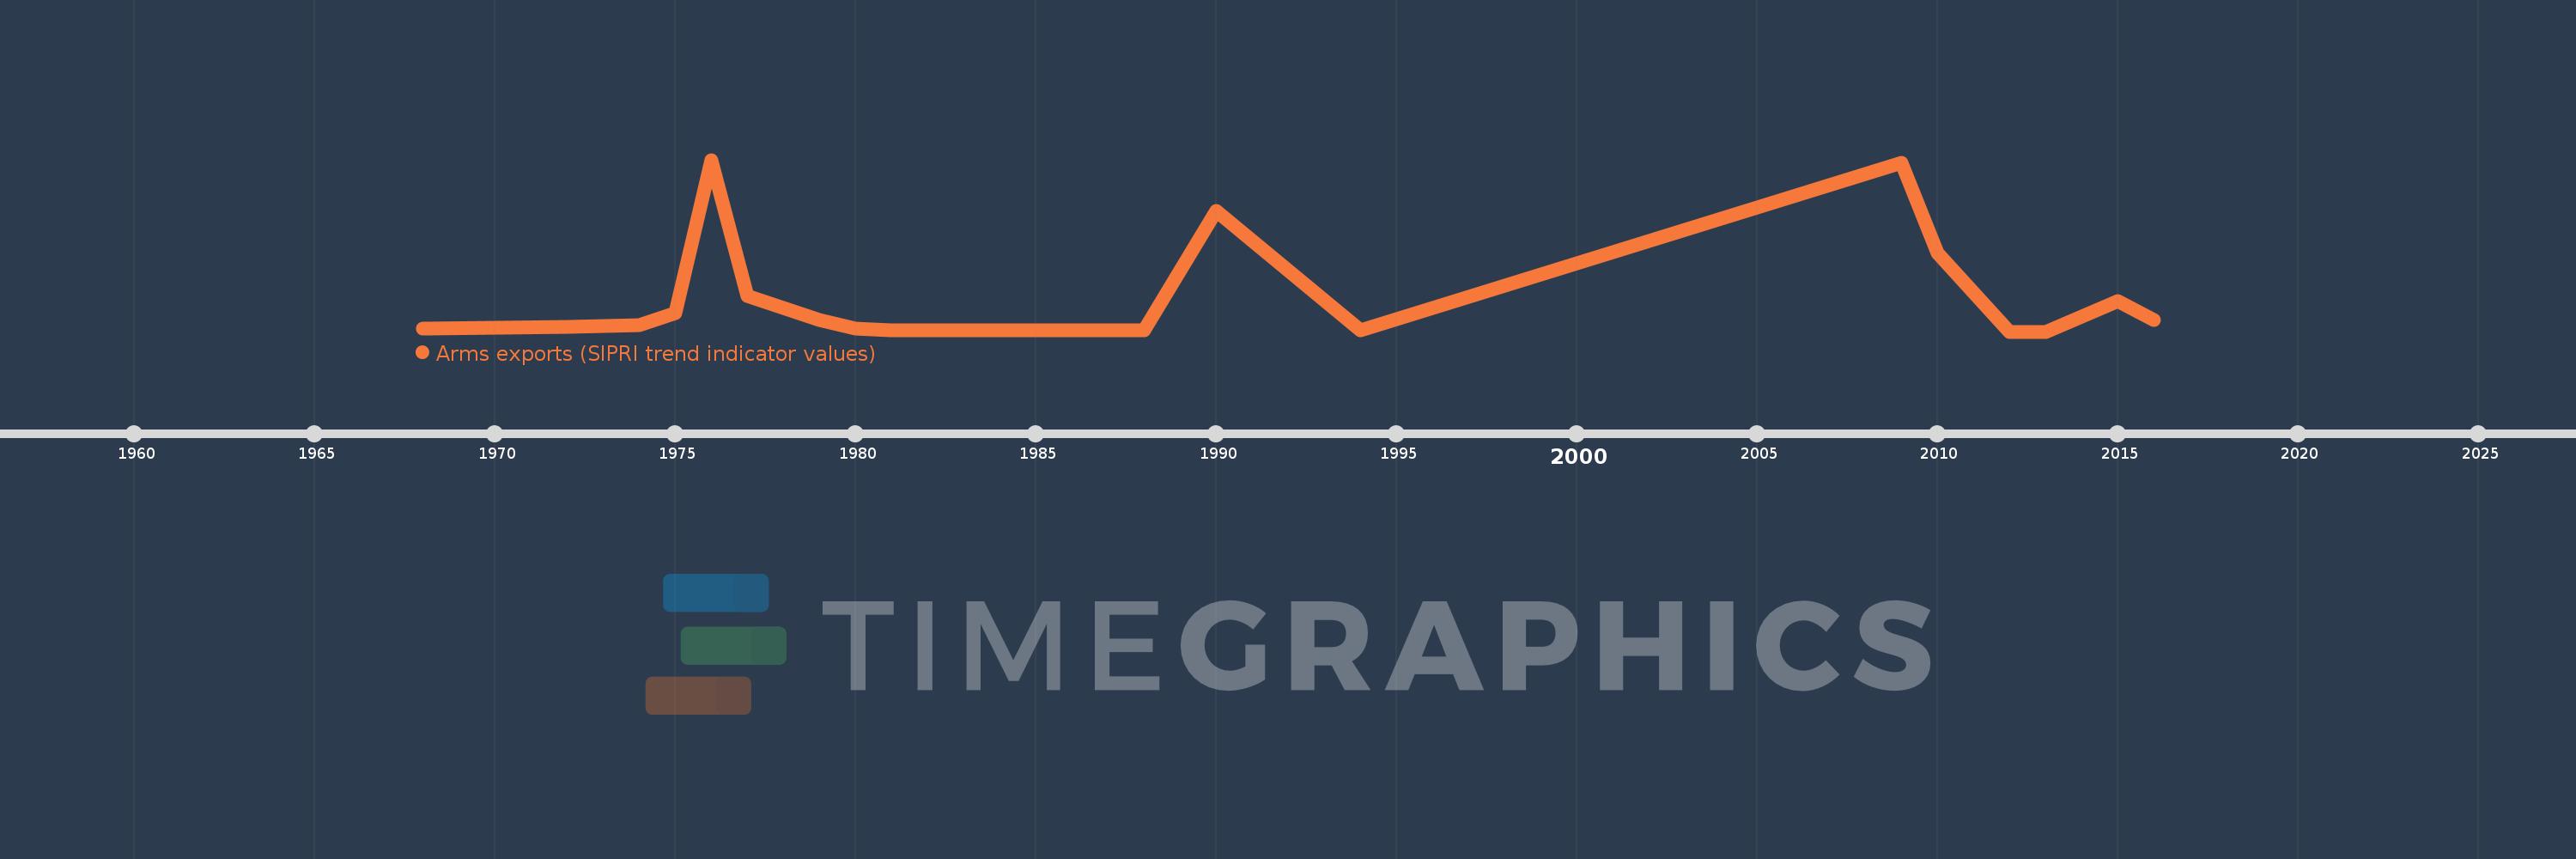
Cette échelle de temps montre un graphique de 1968 année à 2016 année Portugal. Les données jusqu'à 1967 année ne sont pas présentés. Quantité d'observations actuelles selon dates: 20.

Source (désignation):

Les indicateurs du développement mondiale

Source (organisation):

Stockholm International Peace Research Institute (SIPRI), Arms Transfers Programme (http://portal.sipri.org/publications/pages/transfer/splash).

Catégories:

Public Sector, Trade

Dernière mise à jour

23 avr. 2017

Les indicateurs de changement de valeurs selon les années

En moyenne:
19.85 mln.
Minimum:
0.0
1 janv. 2012
Maximum:
101.0 mln.
1 janv. 1976
Pour la date d''observation
Valeur
Changement absolu
Le changement par rapport à la valeur précédente
1 janv. 1968
2.0 mln.
+2.0 mln.
0.0%
1 janv. 1972
3.0 mln.
+1000.0 milles
50.0%
1 janv. 1974
4.0 mln.
+1000.0 milles
33.33%
1 janv. 1975
11.0 mln.
+7.0 mln.
175.0%
1 janv. 1976
101.0 mln.
+90.0 mln.
818.18%
1 janv. 1977
21.0 mln.
-80.0 mln.
-79.21%
1 janv. 1979
7.0 mln.
-14.0 mln.
-66.67%
1 janv. 1980
2.0 mln.
-5.0 mln.
-71.43%
1 janv. 1981
1000.0 milles
-1000.0 milles
-50.0%
1 janv. 1984
1000.0 milles
0.0
0.0%
1 janv. 1987
1000.0 milles
0.0
0.0%
1 janv. 1988
1000.0 milles
0.0
0.0%
1 janv. 1990
71.0 mln.
+70.0 mln.
7.0 milles%
1 janv. 1994
1000.0 milles
-70.0 mln.
-98.59%
1 janv. 2009
99.0 mln.
+98.0 mln.
9.8 milles%
1 janv. 2010
46.0 mln.
-53.0 mln.
-53.54%
1 janv. 2012
0.0
-46.0 mln.
-100.0%
1 janv. 2013
0.0
0.0
%
1 janv. 2015
18.0 mln.
+18.0 mln.
%
1 janv. 2016
7.0 mln.
-11.0 mln.
-61.11%

Classement des pays selon les statistiques actuelles par années