29
/fr/
fr
AIzaSyAYiBZKx7MnpbEhh9jyipgxe19OcubqV5w
April 1, 2024
197166
Moldova
MDA
true
2
1
Arms exports (SIPRI trend indicator values)
2012,2010,2009,2008,2007,2006,2004,2003,2002,2001,1998,1995,1993
Download
Bibliothèque de statistiques globales →Moldova →

Arms exports (SIPRI trend indicator values)

Cette statistique dans les autres pays:
AfghanistanAlbaniaAlgeriaAngolaArab WorldArgentinaArubaAustraliaAustriaBahamas, TheBahrainBangladeshBelarusBelgiumBosnia and HerzegovinaBotswanaBrazilBrunei DarussalamBulgariaCambodiaCanadaCentral Europe and the BalticsChadChileChinaColombiaCongo, Dem. Rep.Costa RicaCote d'IvoireCroatiaCubaCyprusCzech RepublicDenmarkEarly-demographic dividendEast Asia & PacificEast Asia & Pacific (excluding high income)East Asia & Pacific (IDA & IBRD countries)EcuadorEgypt, Arab Rep.El SalvadorEritreaEstoniaEthiopiaEuro areaEurope & Central AsiaEurope & Central Asia (excluding high income)Europe & Central Asia (IDA & IBRD countries)European UnionFijiFinlandFragile and conflict affected situationsFranceGabonGeorgiaGermanyGhanaGreeceGuyanaHeavily indebted poor countries (HIPC)High incomeHungaryIBRD onlyIcelandIDA & IBRD totalIDA blendIDA onlyIDA totalIndiaIndonesiaIran, Islamic Rep.IraqIrelandIsraelItalyJapanJordanKazakhstanKenyaKorea, Dem. People’s Rep.Korea, Rep.KuwaitKyrgyz RepublicLate-demographic dividendLatin America & Caribbean Latin America & Caribbean (excluding high income)Latin America & the Caribbean (IDA & IBRD countries)LatviaLeast developed countries: UN classificationLebanonLibyaLithuaniaLow & middle incomeLow incomeLower middle incomeLuxembourgMacedonia, FYRMalawiMalaysiaMaltaMiddle East & North AfricaMiddle East & North Africa (excluding high income)Middle East & North Africa (IDA & IBRD countries)Middle incomeMoldovaMontenegroMoroccoMozambiqueNetherlandsNew ZealandNicaraguaNigerNigeriaNorth AmericaNorwayOECD membersOmanPakistanPanamaPeruPhilippinesPolandPortugalPost-demographic dividendPre-demographic dividendQatarRomaniaRussian FederationSaudi ArabiaSenegalSerbiaSeychellesSingaporeSlovak RepublicSouth AfricaSouth AsiaSouth Asia (IDA & IBRD)SpainSri LankaSub-Saharan Africa Sub-Saharan Africa (excluding high income)Sub-Saharan Africa (IDA & IBRD countries)SudanSwedenSwitzerlandSyrian Arab RepublicThailandTurkeyUgandaUkraineUnited Arab EmiratesUnited KingdomUnited StatesUpper middle incomeUruguayUzbekistanVenezuela, RBVietnamYemen, Rep.ZambiaZimbabwe
La ligne de temps
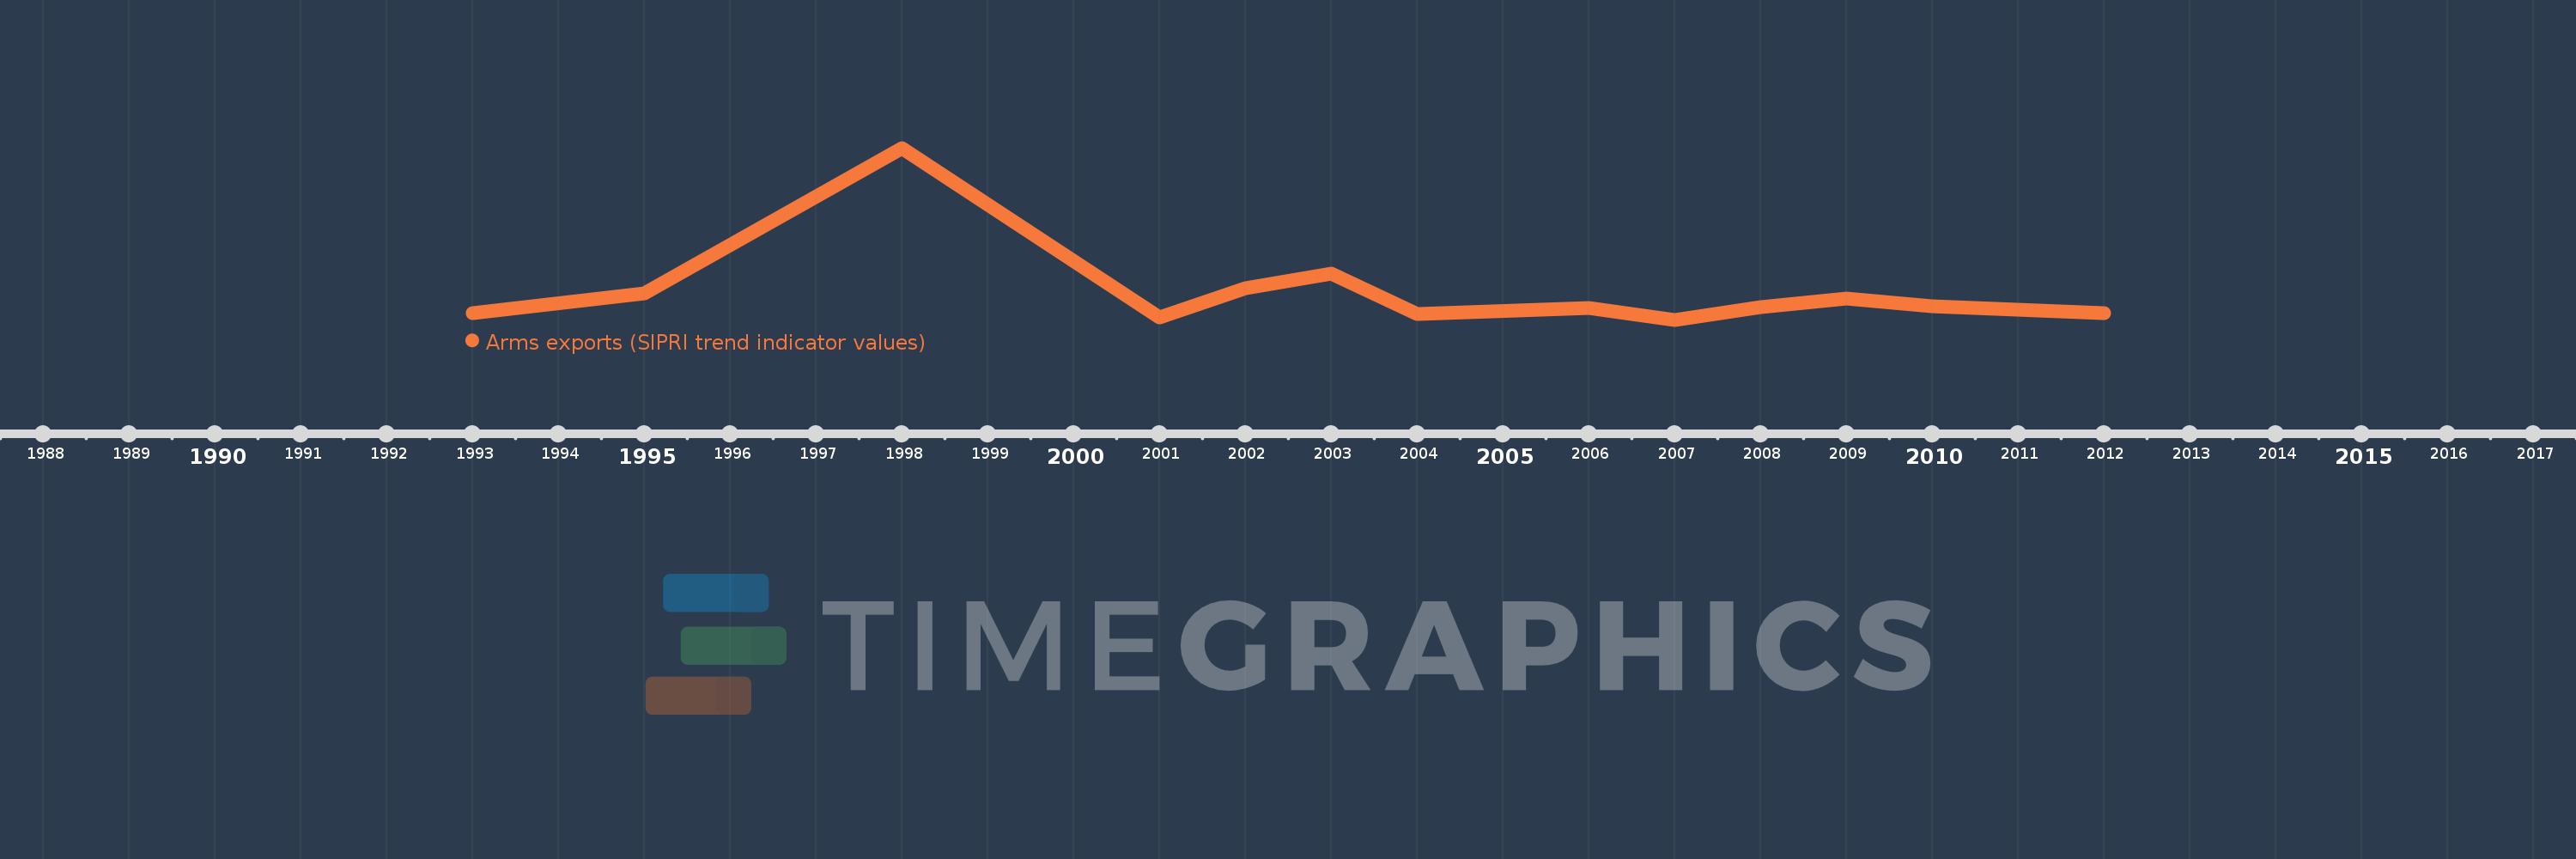
Cette échelle de temps montre un graphique de 1993 année à 2012 année Moldova. Les données jusqu'à 1992 année ne sont pas présentés. Quantité d'observations actuelles selon dates: 13.
Source (désignation):
Les indicateurs du développement mondiale
Source (organisation):
Stockholm International Peace Research Institute (SIPRI), Arms Transfers Programme (http://portal.sipri.org/publications/pages/transfer/splash).
Catégories:
Public Sector, Trade
Dernière mise à jour
23 avr. 2017
Les indicateurs de changement de valeurs selon les années
En moyenne:
37.077 mln.
Minimum:
3.0 mln.
1 janv. 2007
Maximum:
217.0 mln.
1 janv. 1998
Pour la date d''observation
Valeur
Changement absolu
Le changement par rapport à la valeur précédente
1 janv. 1993
11.0 mln.
+11.0 mln.
0.0%
1 janv. 1995
36.0 mln.
+25.0 mln.
227.27%
1 janv. 1998
217.0 mln.
+181.0 mln.
502.78%
1 janv. 2001
6.0 mln.
-211.0 mln.
-97.24%
1 janv. 2002
42.0 mln.
+36.0 mln.
600.0%
1 janv. 2003
60.0 mln.
+18.0 mln.
42.86%
1 janv. 2004
10.0 mln.
-50.0 mln.
-83.33%
1 janv. 2006
18.0 mln.
+8.0 mln.
80.0%
1 janv. 2007
3.0 mln.
-15.0 mln.
-83.33%
1 janv. 2008
19.0 mln.
+16.0 mln.
533.33%
1 janv. 2009
29.0 mln.
+10.0 mln.
52.63%
1 janv. 2010
20.0 mln.
-9.0 mln.
-31.03%
1 janv. 2012
11.0 mln.
-9.0 mln.
-45.0%
Classement des pays selon les statistiques actuelles par années

Commentaires:

Envoyer
PremiumAbout & FeedbackUn accordConfidentialité
logo
© 2022 Selected Technologies LLC – Morgan Hill, California