33
/fr/
AIzaSyB4mHJ5NPEv-XzF7P6NDYXjlkCWaeKw5bc
November 1, 2025
118665
Denmark
DNK
true
2
1
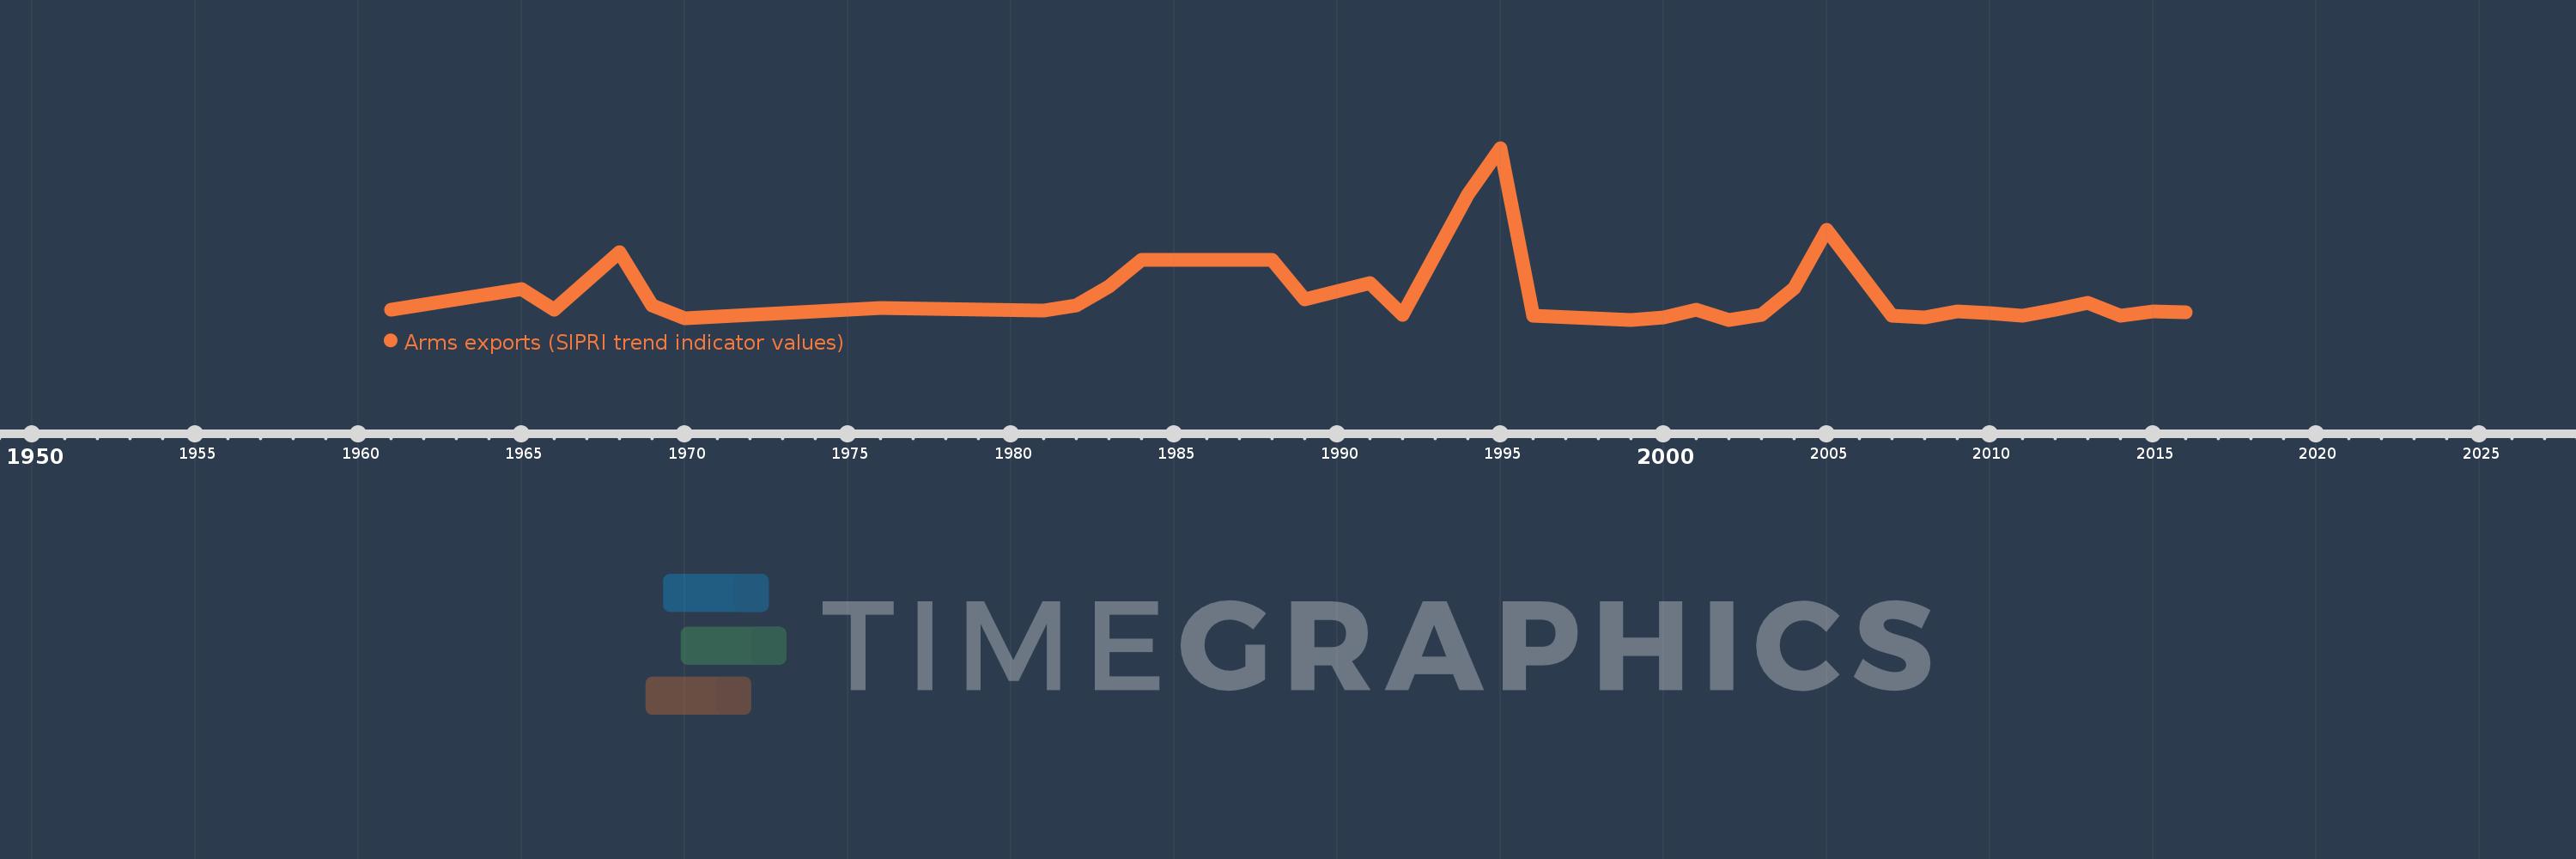
Arms exports (SIPRI trend indicator values)
2016,2015,2014,2013,2012,2011,2010,2009,2008,2007,2005,2004,2003,2002,2001,2000,1999,1996,1995,1994,1992,1991,1989,1988,1984,1983,1982,1981,1976,1970,1969,1968,1966,1965,1961