33
/fr/
AIzaSyAYiBZKx7MnpbEhh9jyipgxe19OcubqV5w
August 1, 2025
34056
Fragile and conflict affected situations
FCS
false
2
1
Arms exports (SIPRI trend indicator values)
1986,1985,1984,1983,1981,1973,1972,1971,1968,1965,1961
Download
Bibliothèque de statistiques globales →Fragile and conflict affected situations →

Arms exports (SIPRI trend indicator values)

Cette statistique dans les autres pays:

AfghanistanAlbaniaAlgeriaAngolaArab WorldArgentinaArubaAustraliaAustriaBahamas, TheBahrainBangladeshBelarusBelgiumBosnia and HerzegovinaBotswanaBrazilBrunei DarussalamBulgariaCambodiaCanadaCentral Europe and the BalticsChadChileChinaColombiaCongo, Dem. Rep.Costa RicaCote d'IvoireCroatiaCubaCyprusCzech RepublicDenmarkEarly-demographic dividendEast Asia & PacificEast Asia & Pacific (excluding high income)East Asia & Pacific (IDA & IBRD countries)EcuadorEgypt, Arab Rep.El SalvadorEritreaEstoniaEthiopiaEuro areaEurope & Central AsiaEurope & Central Asia (excluding high income)Europe & Central Asia (IDA & IBRD countries)European UnionFijiFinlandFragile and conflict affected situationsFranceGabonGeorgiaGermanyGhanaGreeceGuyanaHeavily indebted poor countries (HIPC)High incomeHungaryIBRD onlyIcelandIDA & IBRD totalIDA blendIDA onlyIDA totalIndiaIndonesiaIran, Islamic Rep.IraqIrelandIsraelItalyJapanJordanKazakhstanKenyaKorea, Dem. People’s Rep.Korea, Rep.KuwaitKyrgyz RepublicLate-demographic dividendLatin America & Caribbean Latin America & Caribbean (excluding high income)Latin America & the Caribbean (IDA & IBRD countries)LatviaLeast developed countries: UN classificationLebanonLibyaLithuaniaLow & middle incomeLow incomeLower middle incomeLuxembourgMacedonia, FYRMalawiMalaysiaMaltaMiddle East & North AfricaMiddle East & North Africa (excluding high income)Middle East & North Africa (IDA & IBRD countries)Middle incomeMoldovaMontenegroMoroccoMozambiqueNetherlandsNew ZealandNicaraguaNigerNigeriaNorth AmericaNorwayOECD membersOmanPakistanPanamaPeruPhilippinesPolandPortugalPost-demographic dividendPre-demographic dividendQatarRomaniaRussian FederationSaudi ArabiaSenegalSerbiaSeychellesSingaporeSlovak RepublicSouth AfricaSouth AsiaSouth Asia (IDA & IBRD)SpainSri LankaSub-Saharan Africa Sub-Saharan Africa (excluding high income)Sub-Saharan Africa (IDA & IBRD countries)SudanSwedenSwitzerlandSyrian Arab RepublicThailandTurkeyUgandaUkraineUnited Arab EmiratesUnited KingdomUnited StatesUpper middle incomeUruguayUzbekistanVenezuela, RBVietnamYemen, Rep.ZambiaZimbabwe

La ligne de temps

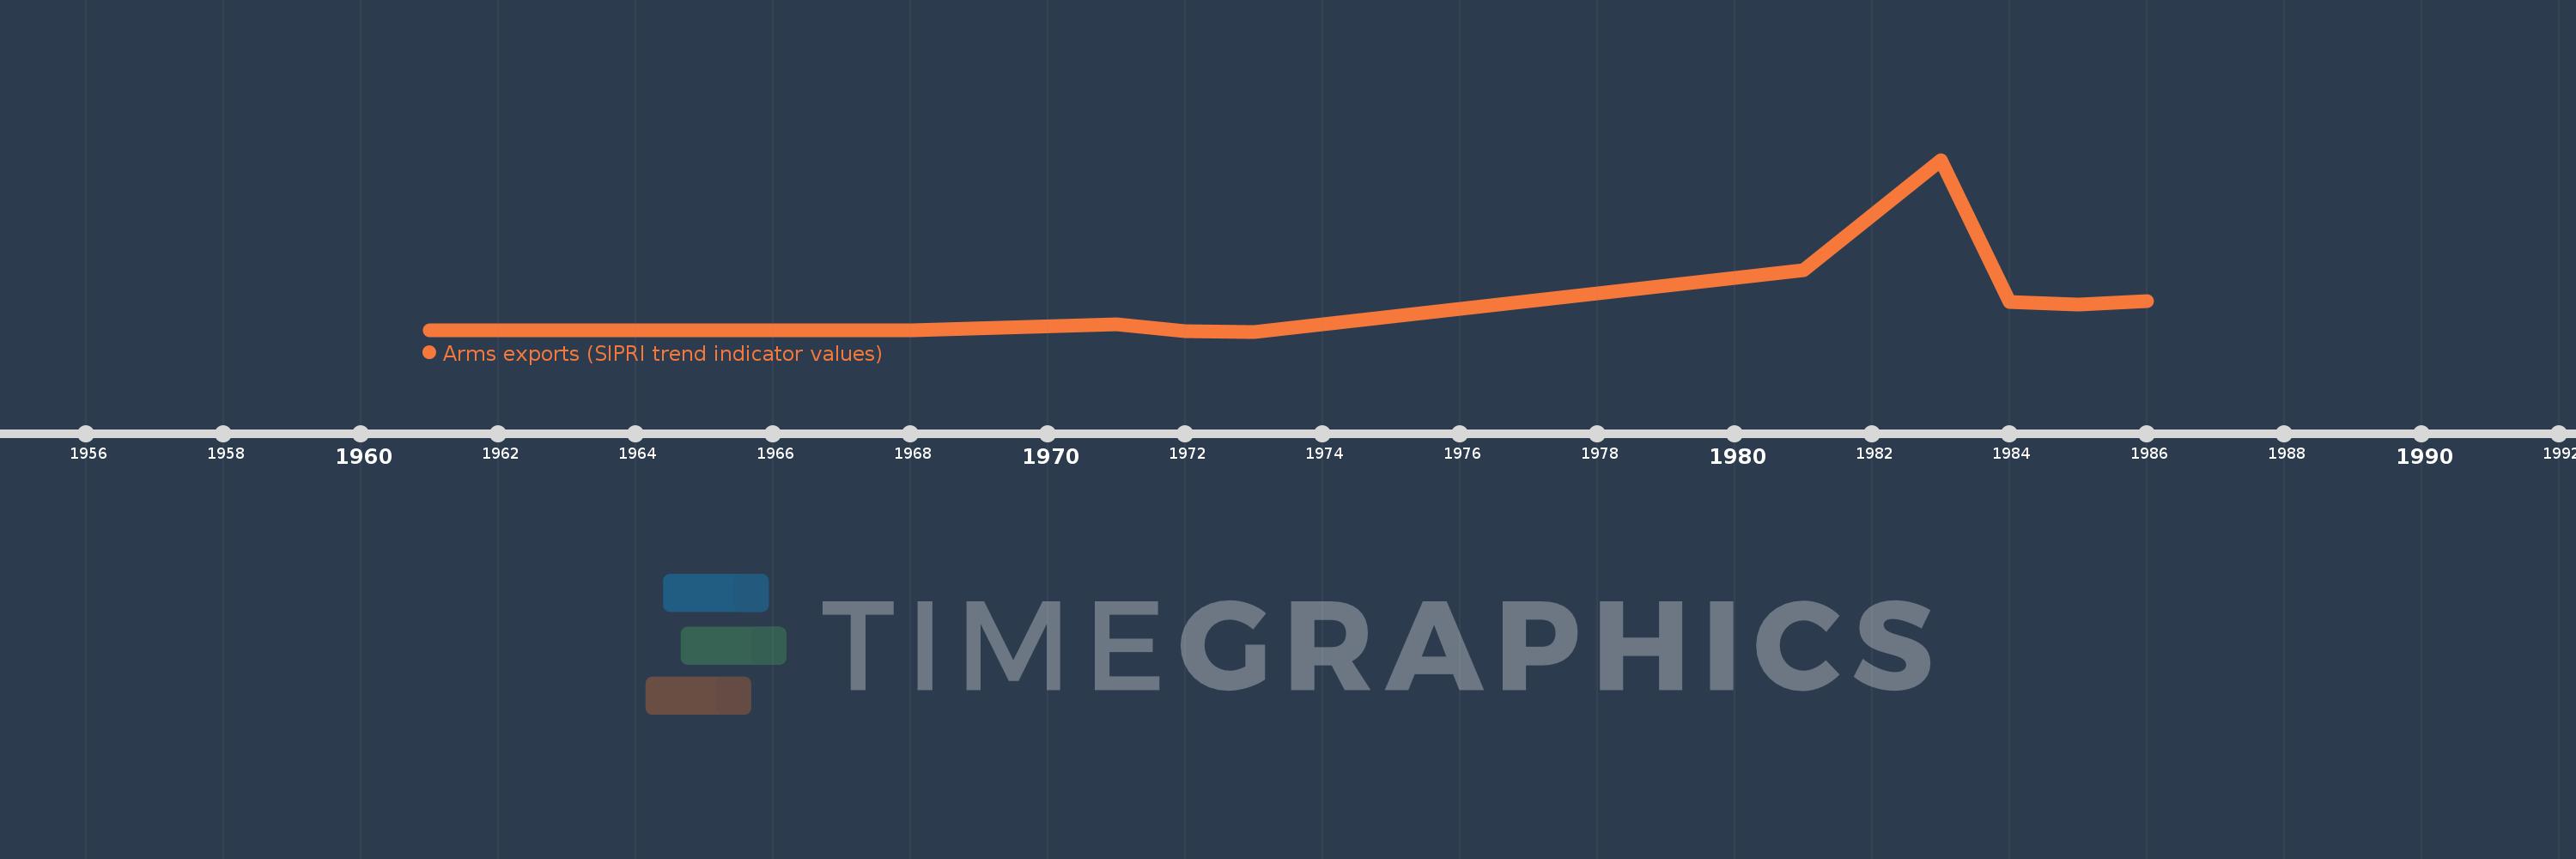
Cette échelle de temps montre un graphique de 1961 année à 1986 année Fragile and conflict affected situations. Les données jusqu'à 1960 année ne sont pas présentés. Quantité d'observations actuelles selon dates: 11.

Source (désignation):

Les indicateurs du développement mondiale

Source (organisation):

Stockholm International Peace Research Institute (SIPRI), Arms Transfers Programme (http://portal.sipri.org/publications/pages/transfer/splash).

Catégories:

Public Sector, Trade

Dernière mise à jour

23 avr. 2017

Les indicateurs de changement de valeurs selon les années

En moyenne:
60.727 mln.
Minimum:
0.0
1 janv. 1973
Maximum:
346.0 mln.
1 janv. 1983
Pour la date d''observation
Valeur
Changement absolu
Le changement par rapport à la valeur précédente
1 janv. 1961
3.0 mln.
+3.0 mln.
0.0%
1 janv. 1965
3.0 mln.
0.0
0.0%
1 janv. 1968
2.0 mln.
-1000.0 milles
-33.33%
1 janv. 1971
14.0 mln.
+12.0 mln.
600.0%
1 janv. 1972
1000.0 milles
-13.0 mln.
-92.86%
1 janv. 1973
0.0
-1000.0 milles
-100.0%
1 janv. 1981
123.0 mln.
+123.0 mln.
%
1 janv. 1983
346.0 mln.
+223.0 mln.
181.3%
1 janv. 1984
60.0 mln.
-286.0 mln.
-82.66%
1 janv. 1985
55.0 mln.
-5.0 mln.
-8.33%
1 janv. 1986
61.0 mln.
+6.0 mln.
10.91%

Classement des pays selon les statistiques actuelles par années