33
/fr/
AIzaSyB4mHJ5NPEv-XzF7P6NDYXjlkCWaeKw5bc
November 1, 2025
124466
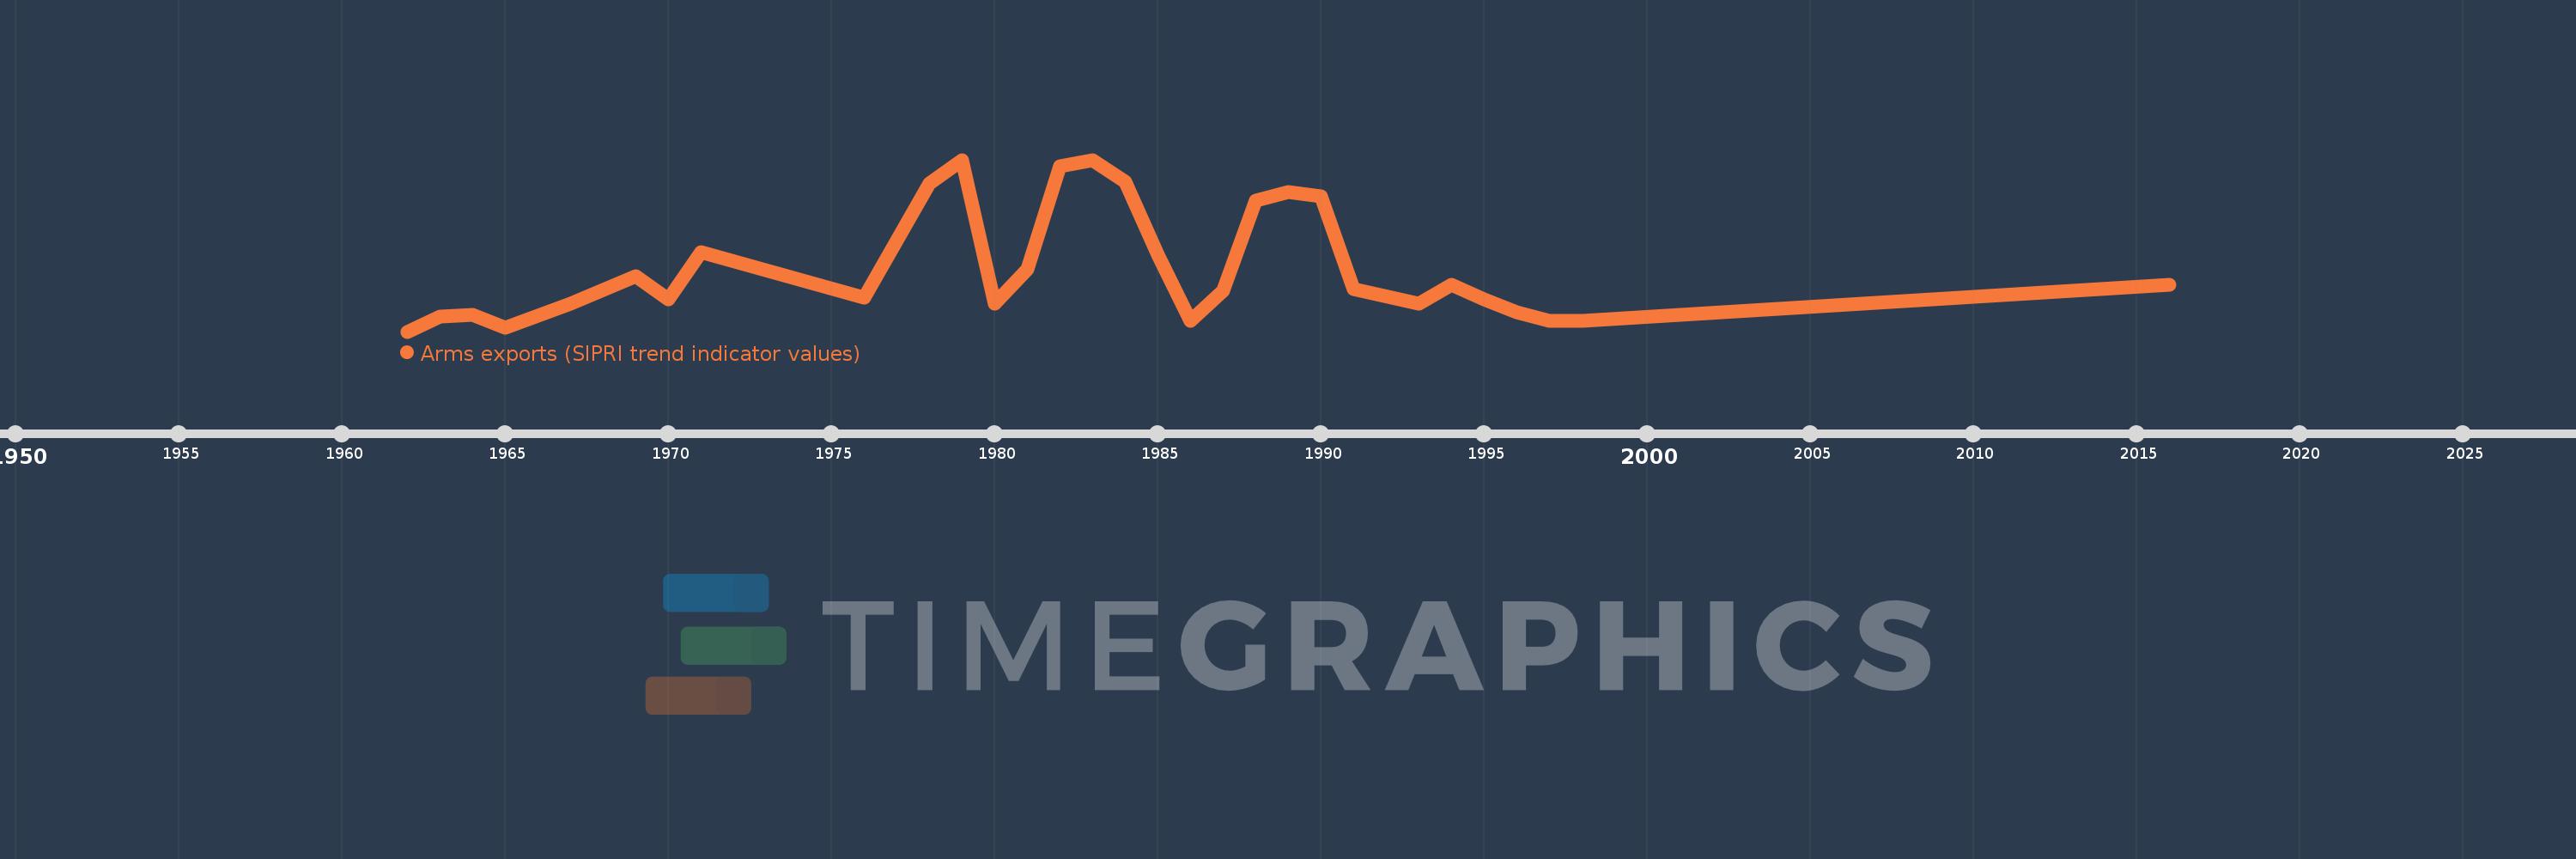
Egypt, Arab Rep.
EGY
true
2
1
Arms exports (SIPRI trend indicator values)
2016,1998,1997,1996,1995,1994,1993,1991,1990,1989,1988,1987,1986,1985,1984,1983,1982,1981,1980,1979,1978,1976,1971,1970,1969,1967,1965,1964,1963,1962