33
/fr/
AIzaSyB4mHJ5NPEv-XzF7P6NDYXjlkCWaeKw5bc
November 30, 2025
63241
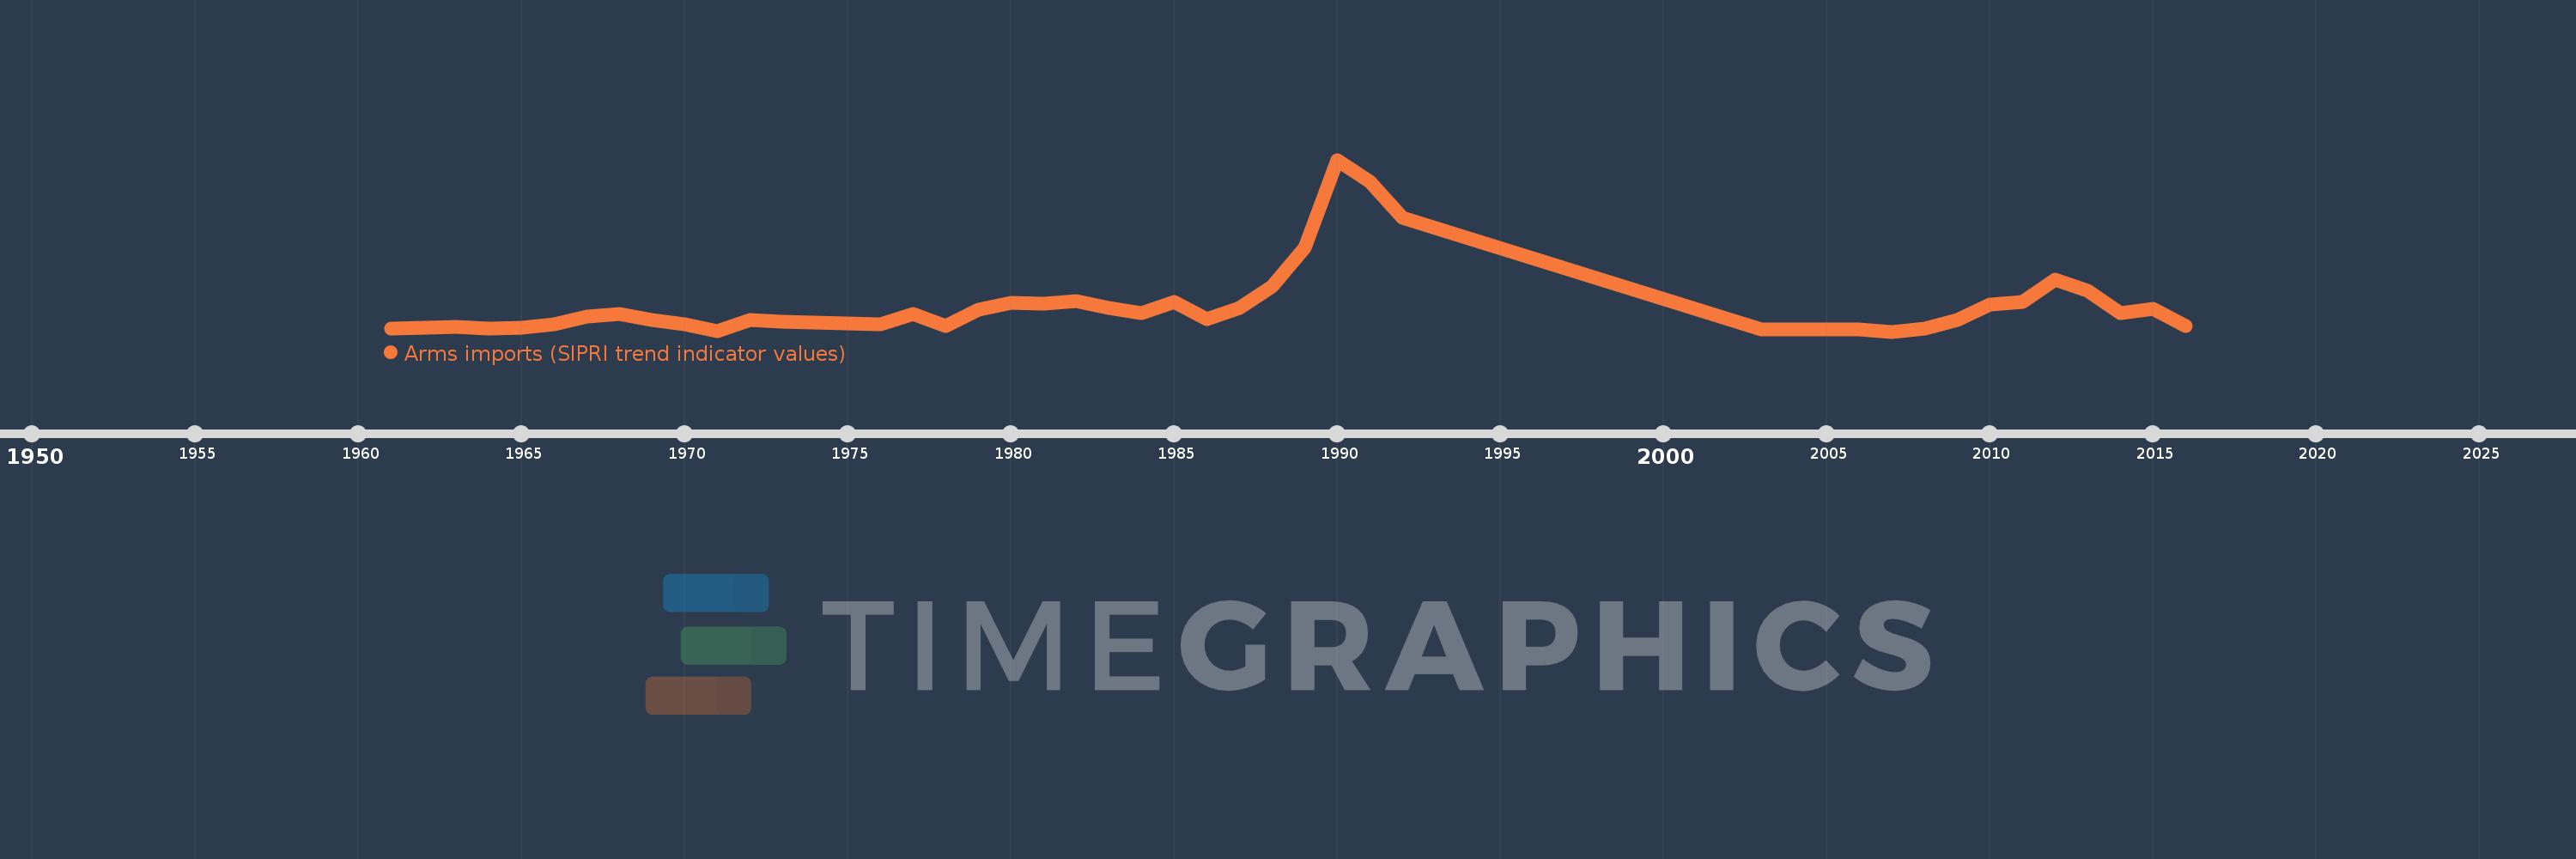
Afghanistan
AFG
true
2
1
Arms imports (SIPRI trend indicator values)
2016,2015,2014,2013,2012,2011,2010,2009,2008,2007,2006,2003,1992,1991,1990,1989,1988,1987,1986,1985,1984,1983,1982,1981,1980,1979,1978,1977,1976,1973,1972,1971,1970,1969,1968,1967,1966,1965,1964,1963,1962,1961