33
/fr/
AIzaSyB4mHJ5NPEv-XzF7P6NDYXjlkCWaeKw5bc
November 30, 2025
173803
Lao PDR
LAO
true
2
1
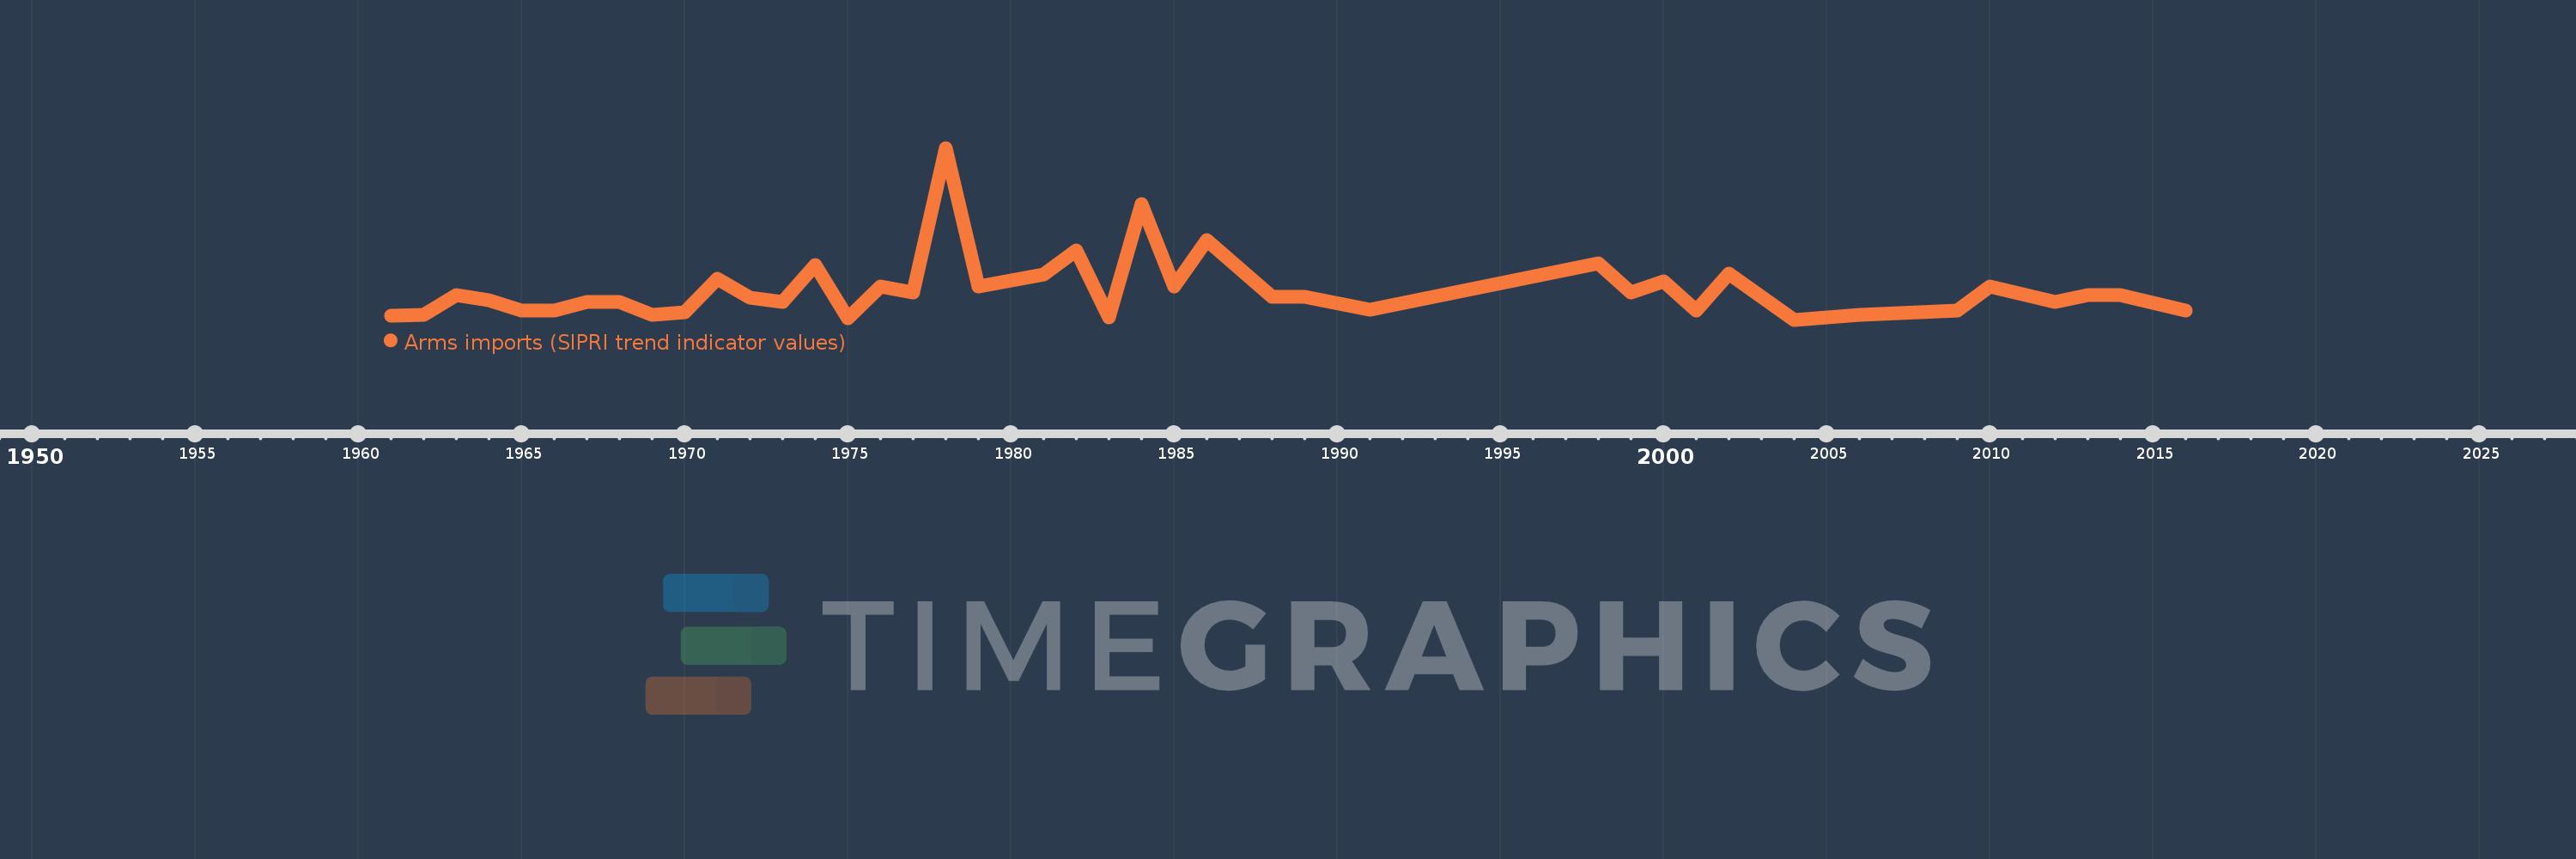
Arms imports (SIPRI trend indicator values)
2016,2014,2013,2012,2010,2009,2006,2004,2002,2001,2000,1999,1998,1991,1989,1988,1986,1985,1984,1983,1982,1981,1979,1978,1977,1976,1975,1974,1973,1972,1971,1970,1969,1968,1967,1966,1965,1964,1963,1962,1961