33
/fr/
AIzaSyB4mHJ5NPEv-XzF7P6NDYXjlkCWaeKw5bc
November 30, 2025
189893
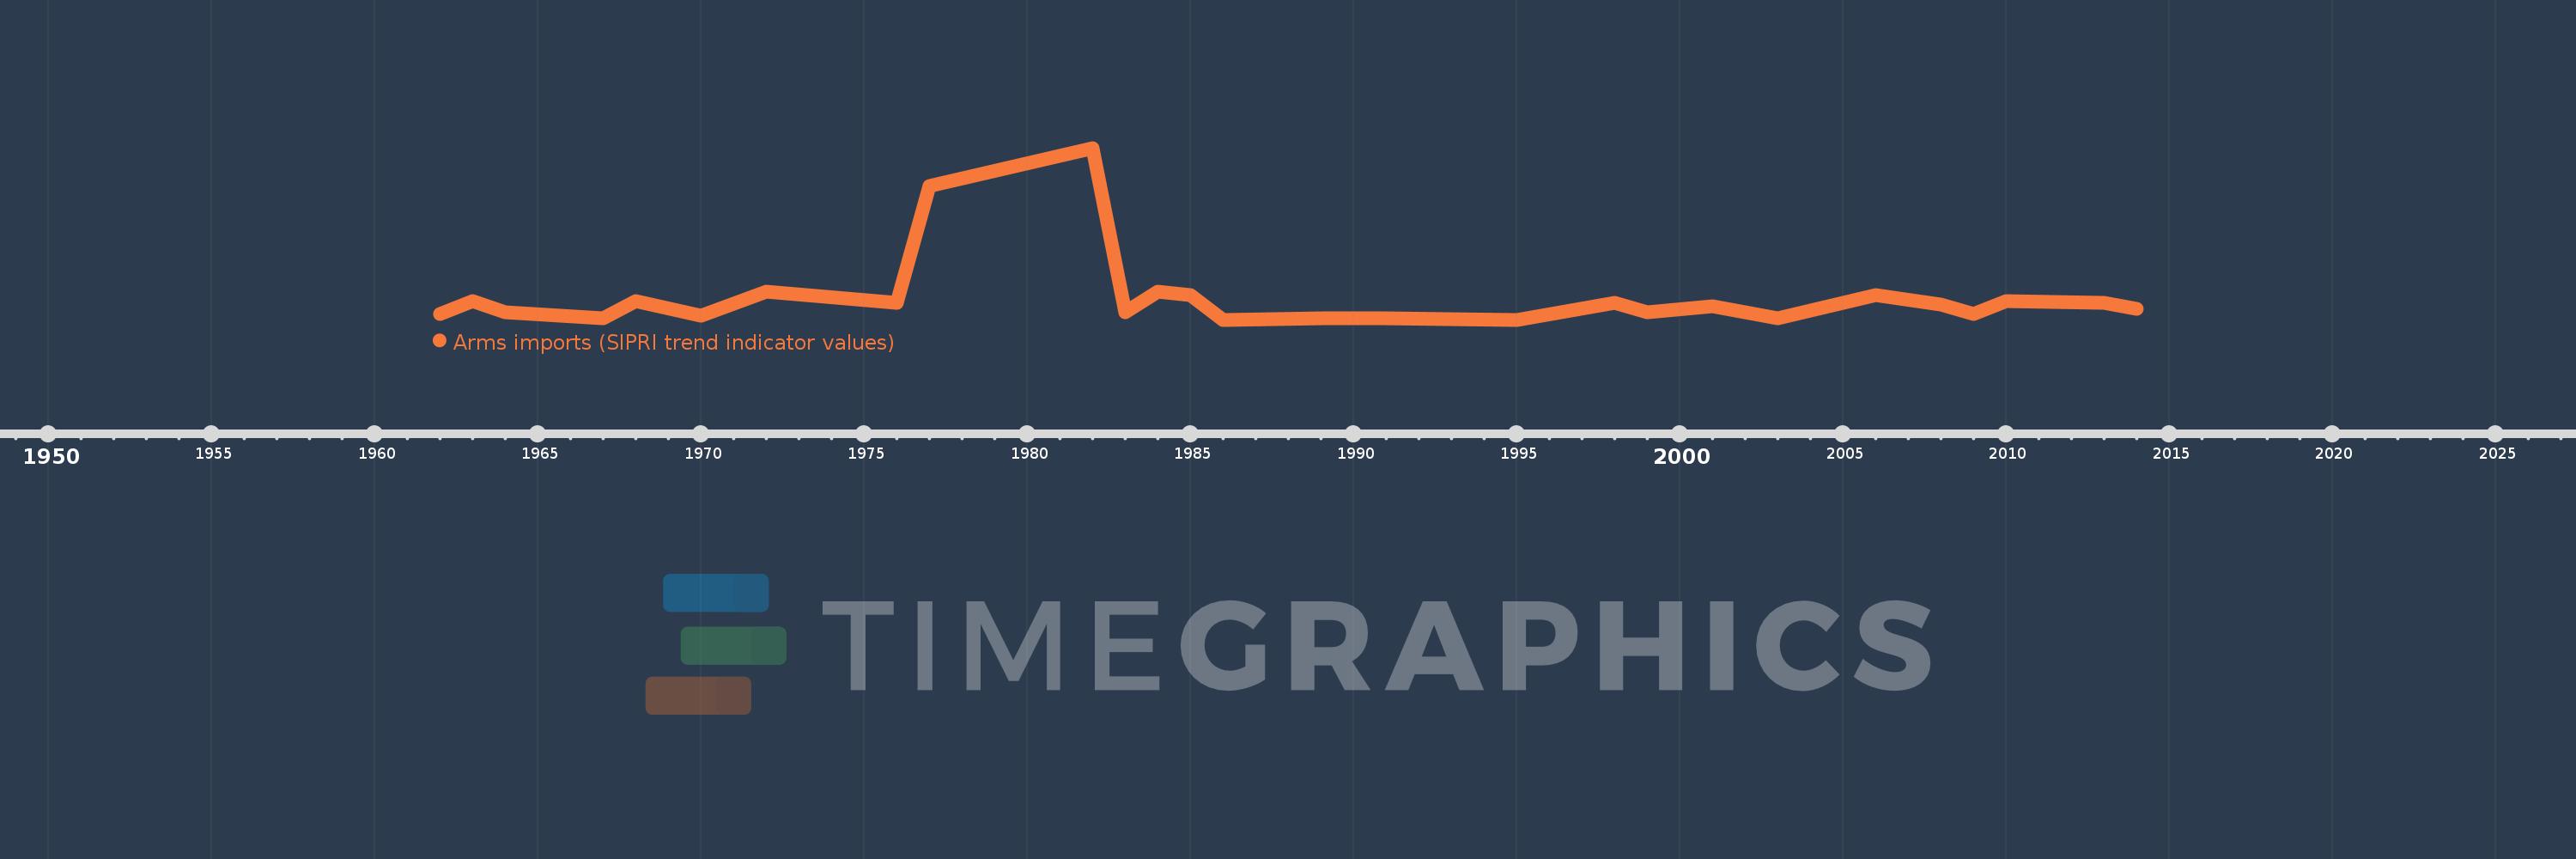
Mali
MLI
true
2
1
Arms imports (SIPRI trend indicator values)
2014,2013,2010,2009,2008,2006,2003,2001,1999,1998,1995,1991,1989,1986,1985,1984,1983,1982,1977,1976,1972,1970,1968,1967,1964,1963,1962