33
/fr/
AIzaSyB4mHJ5NPEv-XzF7P6NDYXjlkCWaeKw5bc
November 30, 2025
230686
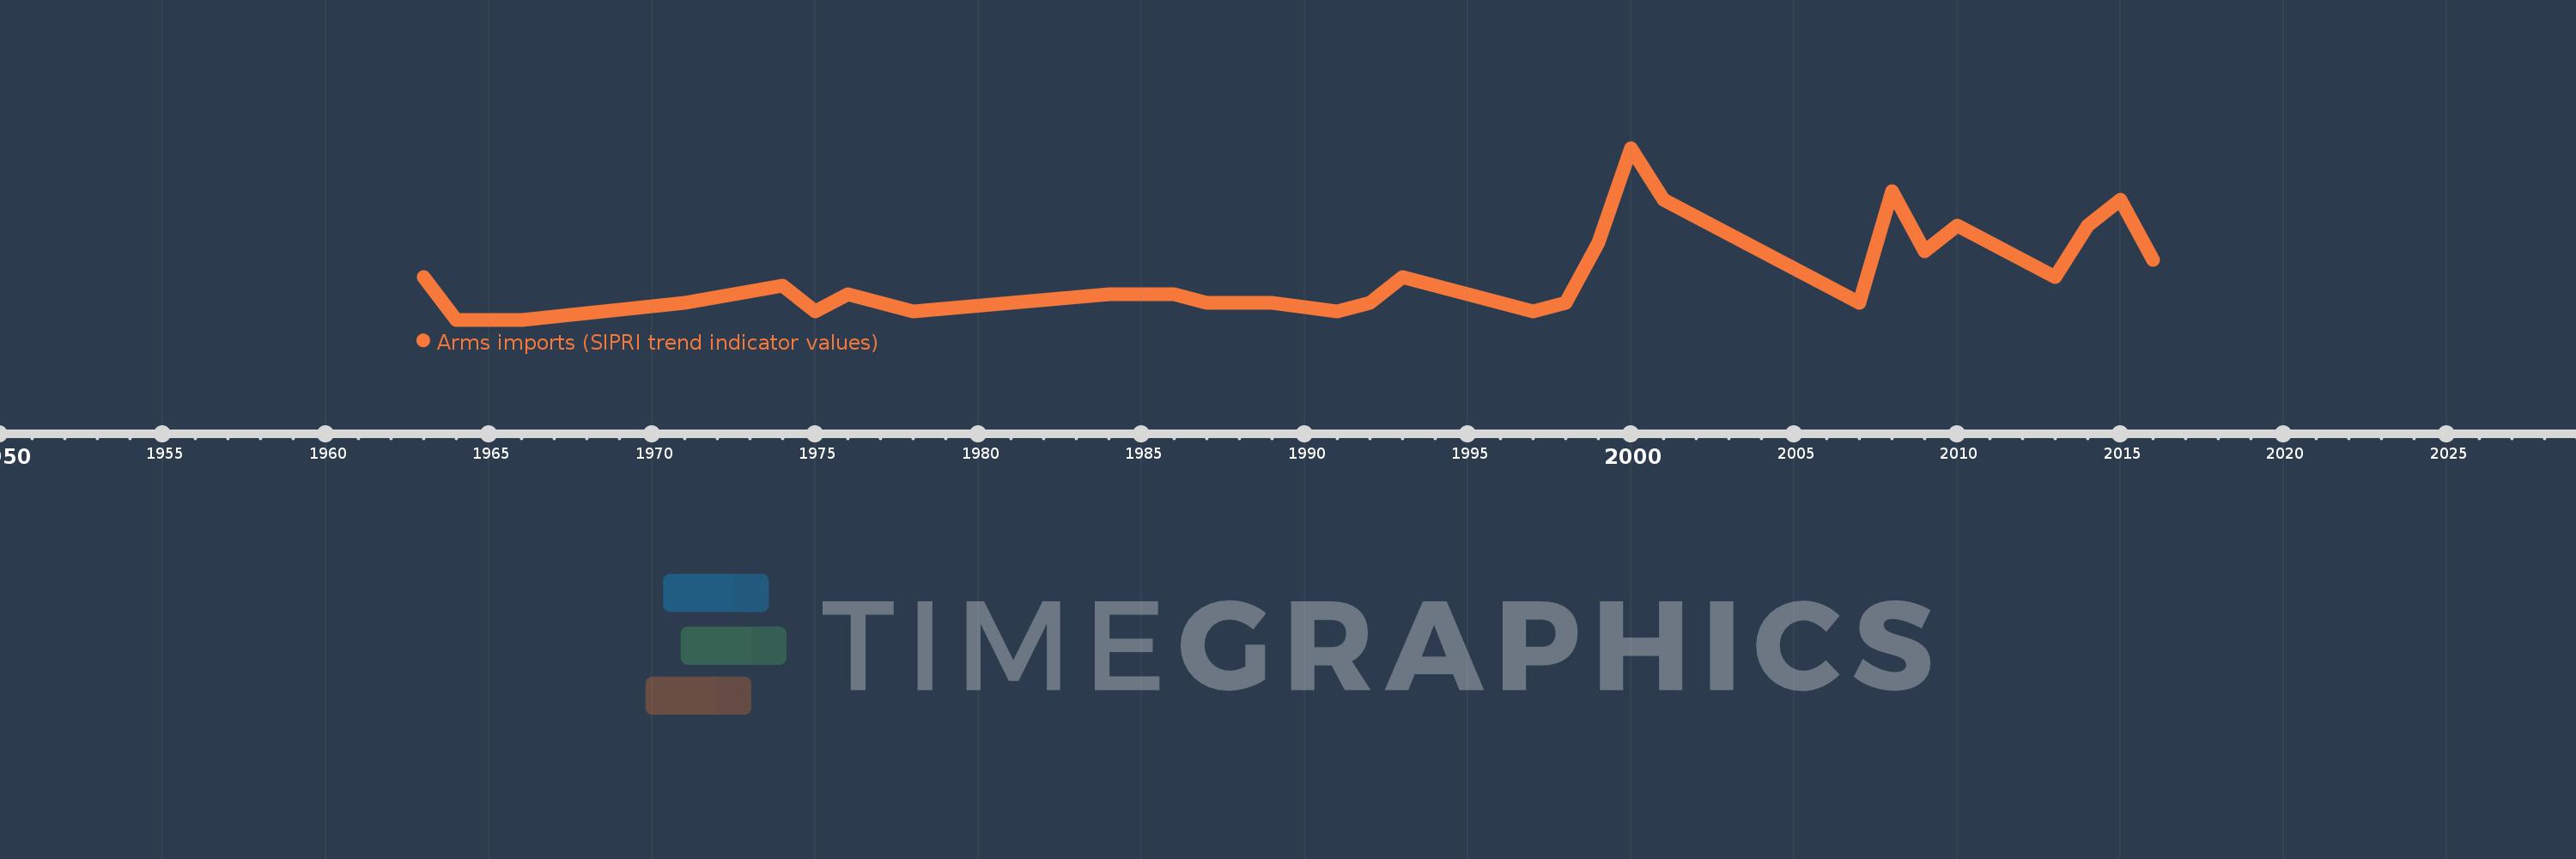
Rwanda
RWA
true
2
1
Arms imports (SIPRI trend indicator values)
2016,2015,2014,2013,2010,2009,2008,2007,2001,2000,1999,1998,1997,1993,1992,1991,1989,1987,1986,1985,1984,1978,1976,1975,1974,1971,1966,1965,1964,1963