33
/fr/
AIzaSyB4mHJ5NPEv-XzF7P6NDYXjlkCWaeKw5bc
November 1, 2025
116650
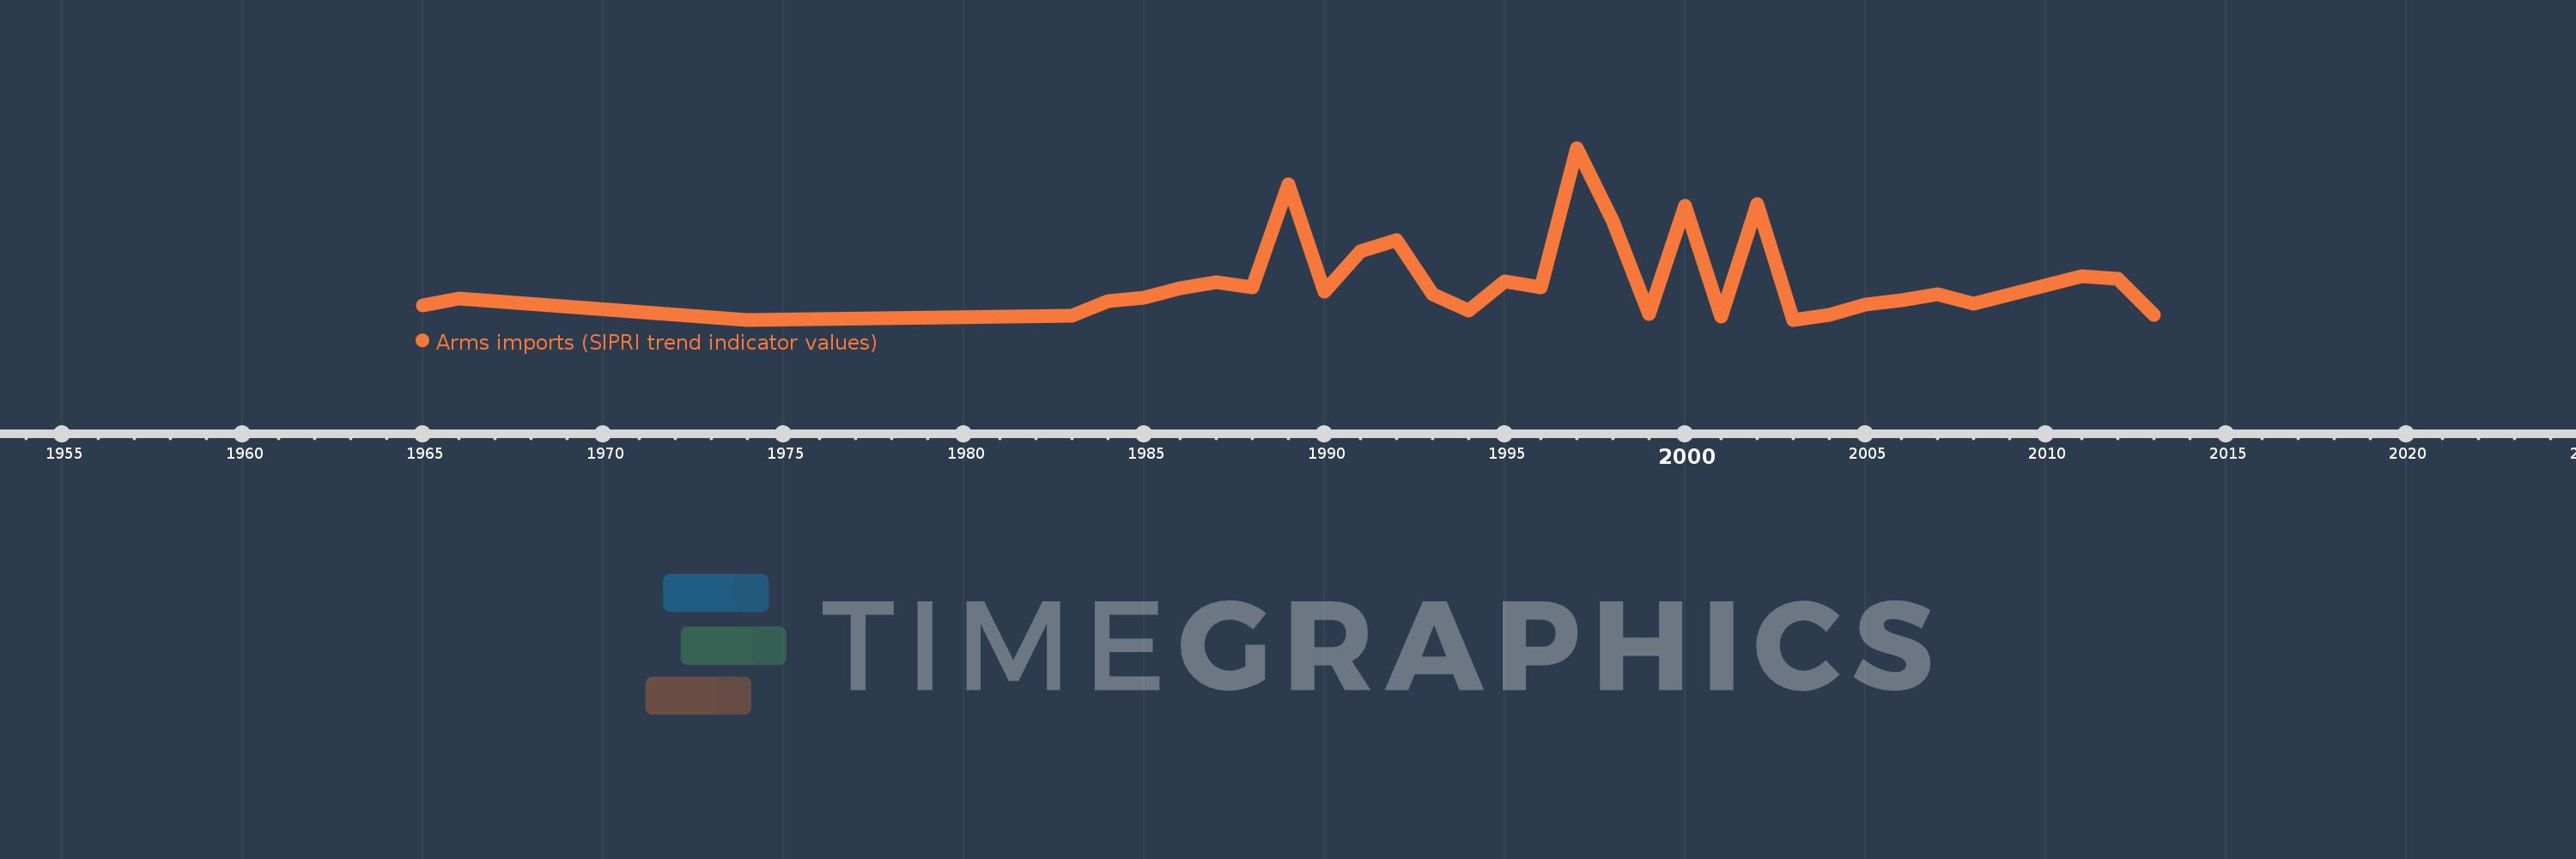
Cyprus
CYP
true
2
1
Arms imports (SIPRI trend indicator values)
2013,2012,2011,2008,2007,2006,2005,2004,2003,2002,2001,2000,1999,1998,1997,1996,1995,1994,1993,1992,1991,1990,1989,1988,1987,1986,1985,1984,1983,1974,1966,1965