33
/fr/
AIzaSyB4mHJ5NPEv-XzF7P6NDYXjlkCWaeKw5bc
November 30, 2025
260523
Tanzania
TZA
true
2
1
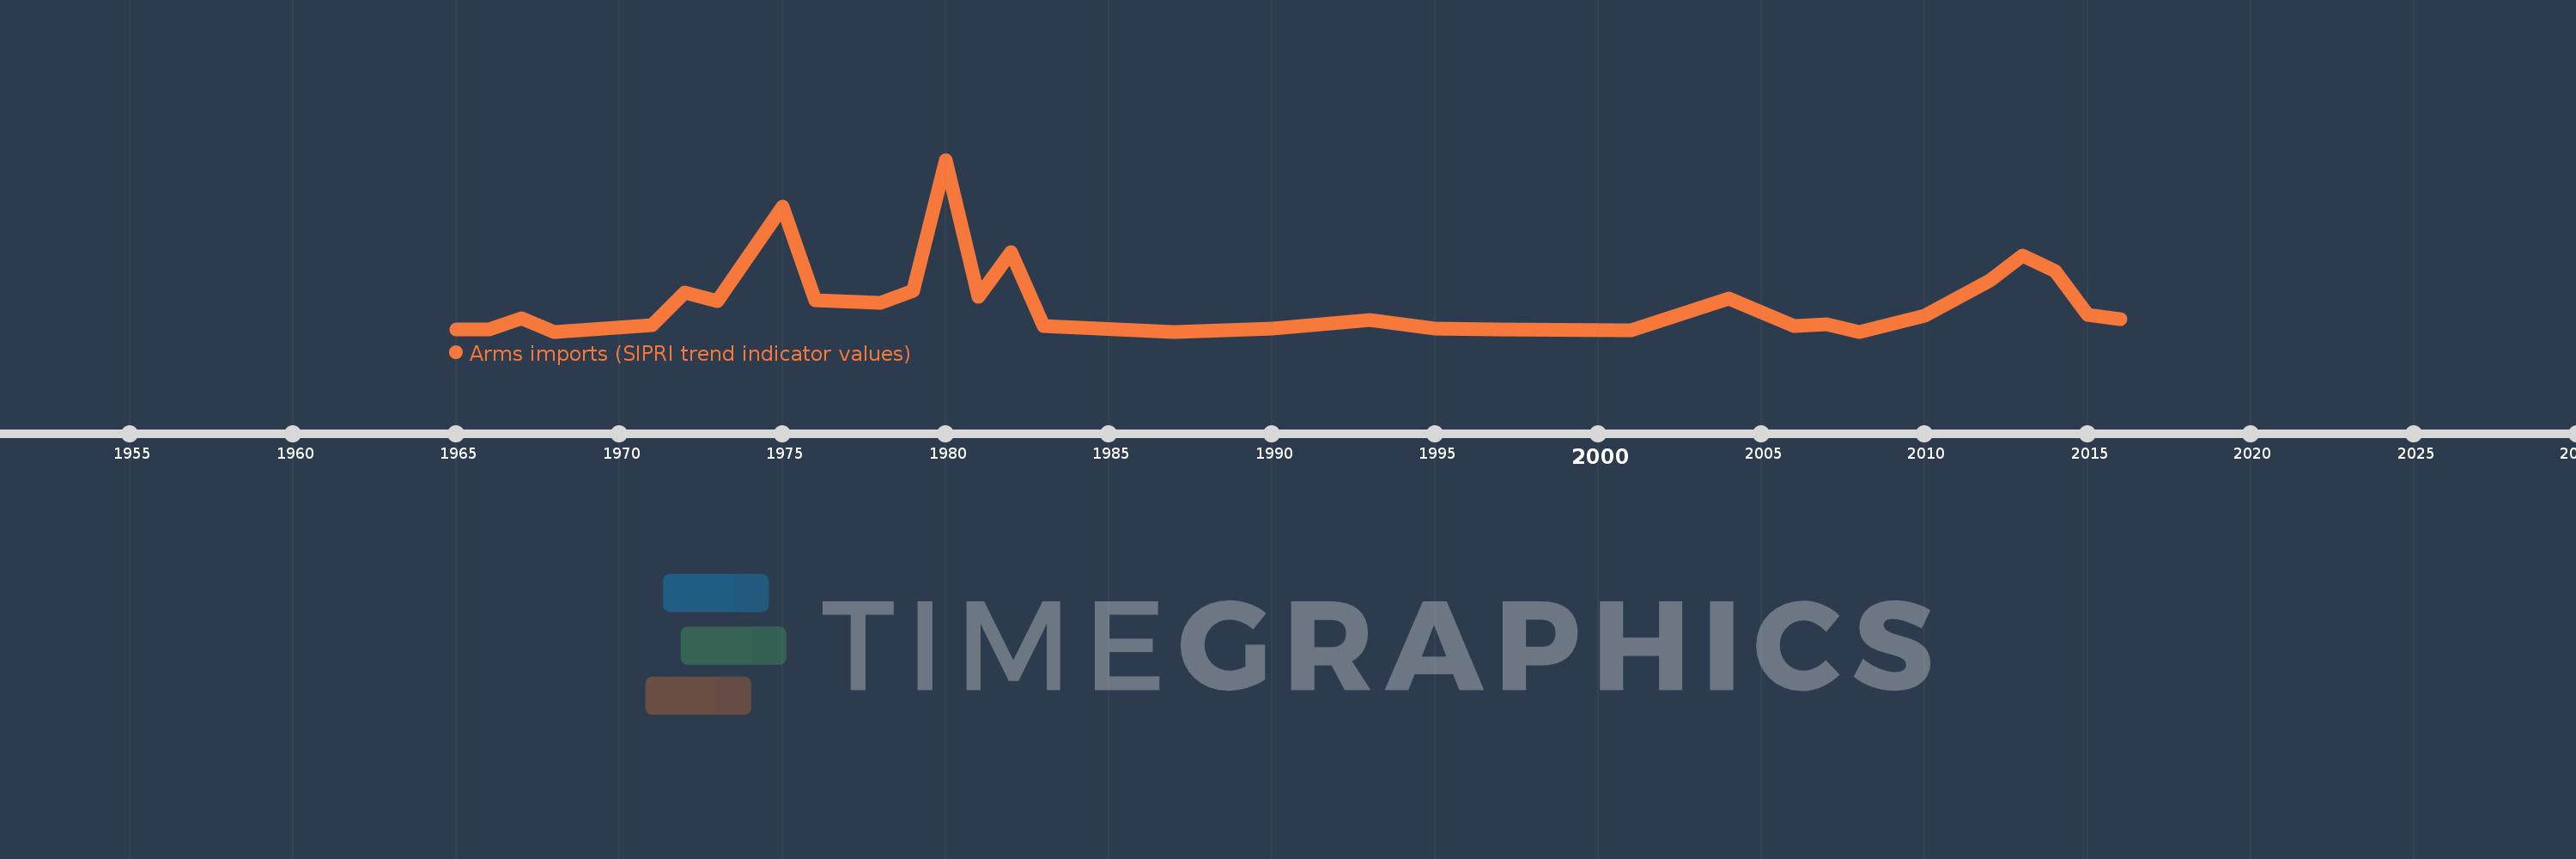
Arms imports (SIPRI trend indicator values)
2016,2015,2014,2013,2012,2010,2008,2007,2006,2004,2001,1997,1995,1993,1990,1987,1983,1982,1981,1980,1979,1978,1976,1975,1974,1973,1972,1971,1968,1967,1966,1965