29
/fr/
fr
AIzaSyAYiBZKx7MnpbEhh9jyipgxe19OcubqV5w
April 1, 2024
45869
Low income
LIC
false
2
1
Arms imports (SIPRI trend indicator values)
2014,2013,1987,1986,1985,1984,1983,1982,1979,1978,1975,1974,1971,1970,1969,1968,1967,1966,1965,1964,1963,1962,1961
Download
Bibliothèque de statistiques globales →Low income →

Arms imports (SIPRI trend indicator values)

Cette statistique dans les autres pays:
AfghanistanAlbaniaAlgeriaAngolaArab WorldArgentinaArmeniaAustraliaAustriaAzerbaijanBahamas, TheBahrainBangladeshBarbadosBelarusBelgiumBelizeBeninBhutanBoliviaBosnia and HerzegovinaBotswanaBrazilBrunei DarussalamBulgariaBurkina FasoBurundiCabo VerdeCambodiaCameroonCanadaCaribbean small statesCentral African RepublicCentral Europe and the BalticsChadChileChinaColombiaComorosCongo, Dem. Rep.Congo, Rep.Costa RicaCote d'IvoireCroatiaCubaCyprusCzech RepublicDenmarkDjiboutiDominican RepublicEarly-demographic dividendEast Asia & PacificEast Asia & Pacific (excluding high income)East Asia & Pacific (IDA & IBRD countries)EcuadorEgypt, Arab Rep.El SalvadorEquatorial GuineaEritreaEstoniaEthiopiaEuro areaEurope & Central AsiaEurope & Central Asia (excluding high income)Europe & Central Asia (IDA & IBRD countries)European UnionFijiFinlandFragile and conflict affected situationsFranceGabonGambia, TheGeorgiaGermanyGhanaGreeceGrenadaGuatemalaGuineaGuinea-BissauGuyanaHaitiHeavily indebted poor countries (HIPC)High incomeHondurasHungaryIBRD onlyIcelandIDA & IBRD totalIDA blendIDA onlyIDA totalIndiaIndonesiaIran, Islamic Rep.IraqIrelandIsraelItalyJamaicaJapanJordanKazakhstanKenyaKiribatiKorea, Dem. People’s Rep.Korea, Rep.KosovoKuwaitKyrgyz RepublicLao PDRLate-demographic dividendLatin America & Caribbean Latin America & Caribbean (excluding high income)Latin America & the Caribbean (IDA & IBRD countries)LatviaLeast developed countries: UN classificationLebanonLesothoLiberiaLibyaLithuaniaLow & middle incomeLow incomeLower middle incomeLuxembourgMacedonia, FYRMadagascarMalawiMalaysiaMaldivesMaliMaltaMarshall IslandsMauritaniaMauritiusMexicoMicronesia, Fed. Sts.Middle East & North AfricaMiddle East & North Africa (excluding high income)Middle East & North Africa (IDA & IBRD countries)Middle incomeMoldovaMongoliaMoroccoMozambiqueMyanmarNamibiaNepalNetherlandsNew ZealandNicaraguaNigerNigeriaNorth AmericaNorwayOECD membersOmanOther small statesPacific island small statesPakistanPalauPanamaPapua New GuineaParaguayPeruPhilippinesPolandPortugalPost-demographic dividendPre-demographic dividendQatarRomaniaRussian FederationRwandaSamoaSaudi ArabiaSenegalSerbiaSeychellesSierra LeoneSingaporeSlovak RepublicSloveniaSmall statesSolomon IslandsSomaliaSouth AfricaSouth AsiaSouth Asia (IDA & IBRD)South SudanSpainSri LankaSt. Kitts and NevisSt. Vincent and the GrenadinesSub-Saharan Africa Sub-Saharan Africa (excluding high income)Sub-Saharan Africa (IDA & IBRD countries)SudanSurinameSwazilandSwedenSwitzerlandSyrian Arab RepublicTajikistanTanzaniaThailandTimor-LesteTogoTongaTrinidad and TobagoTunisiaTurkeyTurkmenistanTuvaluUgandaUkraineUnited Arab EmiratesUnited KingdomUnited StatesUpper middle incomeUruguayUzbekistanVanuatuVenezuela, RBVietnamWest Bank and GazaWorldYemen, Rep.ZambiaZimbabwe
La ligne de temps
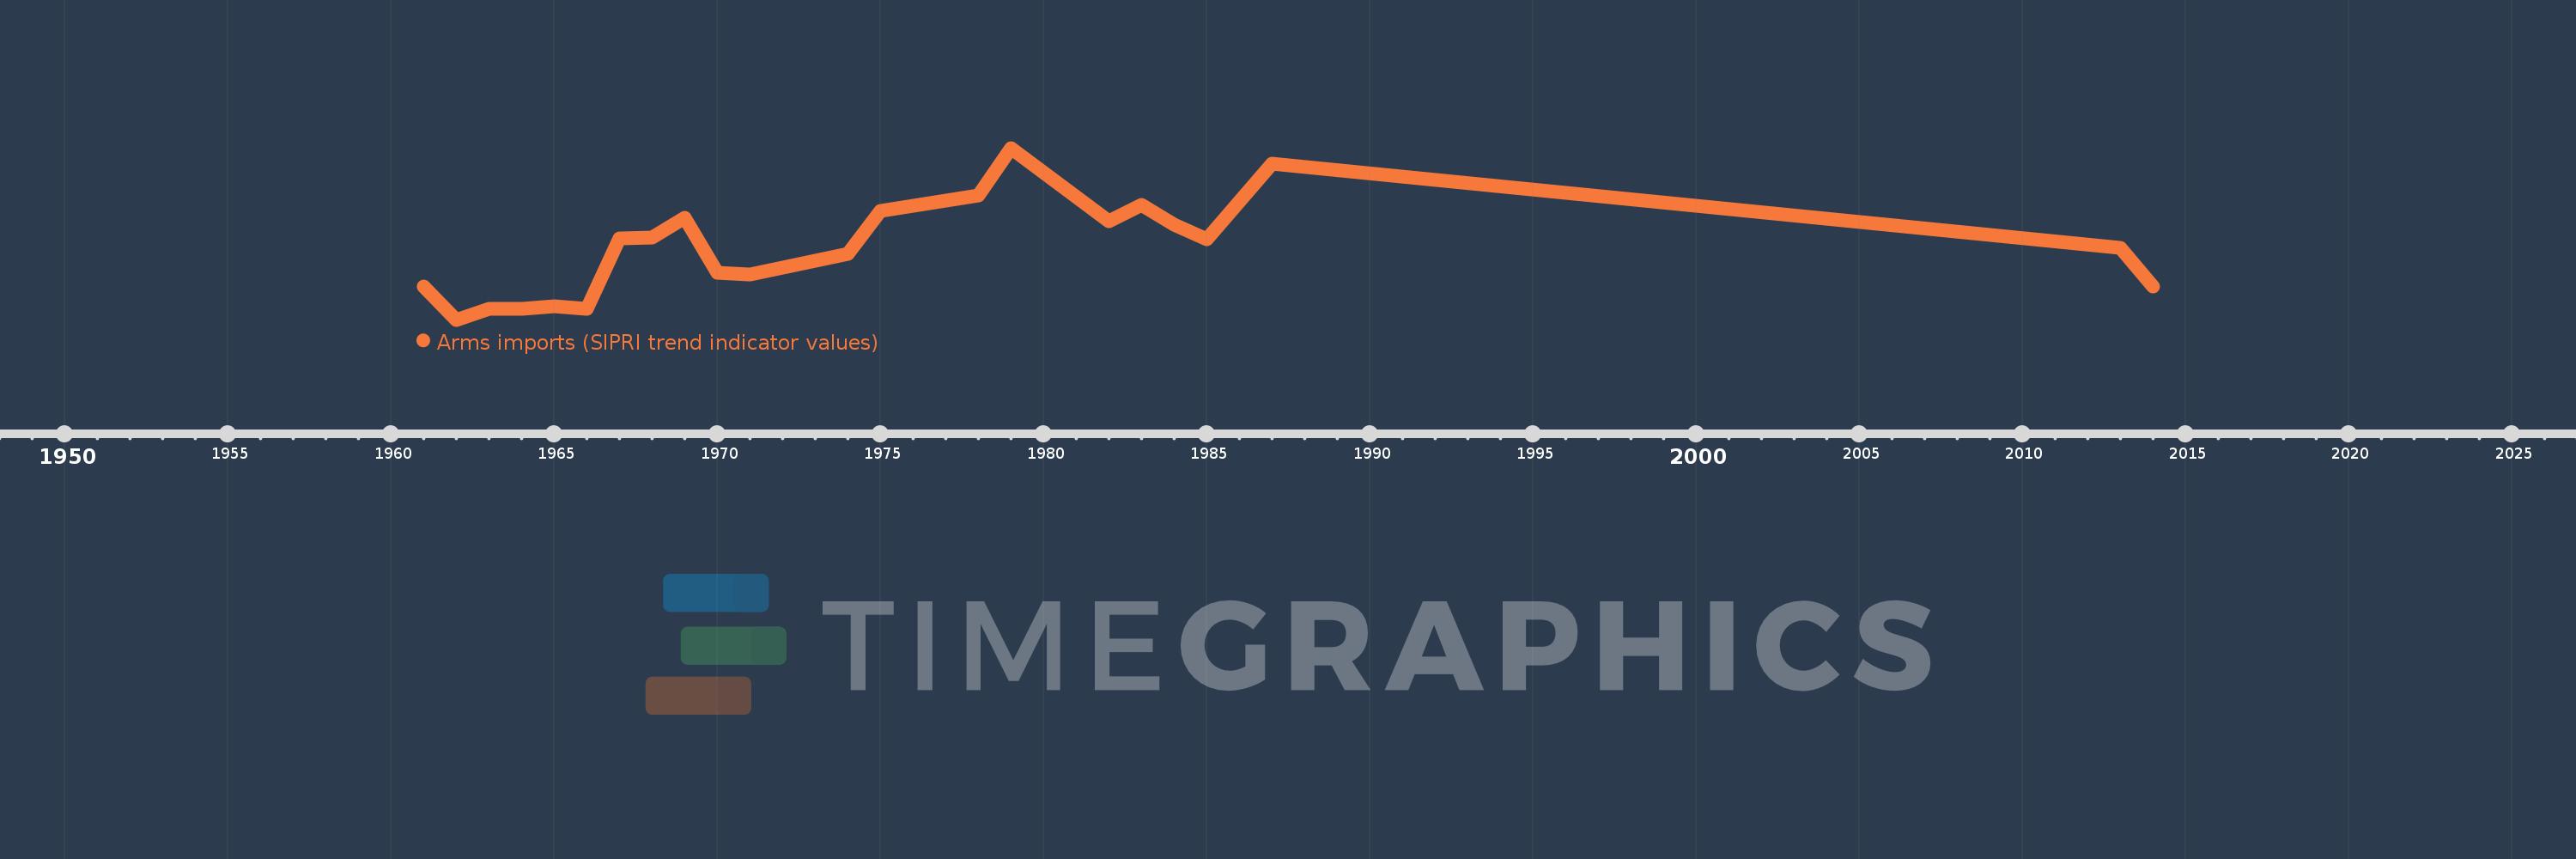
Cette échelle de temps montre un graphique de 1961 année à 2014 année Low income. Les données jusqu'à 1960 année ne sont pas présentés. Quantité d'observations actuelles selon dates: 23.
Source (désignation):
Les indicateurs du développement mondiale
Source (organisation):
Stockholm International Peace Research Institute (SIPRI), Arms Transfers Programme (http://portal.sipri.org/publications/pages/transfer/splash).
Catégories:
Public Sector, Trade
Dernière mise à jour
23 avr. 2017
Les indicateurs de changement de valeurs selon les années
En moyenne:
1.136 mds
Minimum:
184.0 mln.
1 janv. 1962
Maximum:
2.429 mds
1 janv. 1979
Pour la date d''observation
Valeur
Changement absolu
Le changement par rapport à la valeur précédente
1 janv. 1961
619.0 mln.
+619.0 mln.
0.0%
1 janv. 1962
184.0 mln.
-435.0 mln.
-70.27%
1 janv. 1963
330.0 mln.
+146.0 mln.
79.35%
1 janv. 1964
325.0 mln.
-5.0 mln.
-1.52%
1 janv. 1965
357.0 mln.
+32.0 mln.
9.85%
1 janv. 1966
332.0 mln.
-25.0 mln.
-7.0%
1 janv. 1967
1.247 mds
+915.0 mln.
275.6%
1 janv. 1968
1.254 mds
+7.0 mln.
0.56%
1 janv. 1969
1.512 mds
+258.0 mln.
20.57%
1 janv. 1970
798.0 mln.
-714.0 mln.
-47.22%
1 janv. 1971
773.0 mln.
-25.0 mln.
-3.13%
1 janv. 1974
1.043 mds
+270.0 mln.
34.93%
1 janv. 1975
1.605 mds
+562.0 mln.
53.88%
1 janv. 1978
1.804 mds
+199.0 mln.
12.4%
1 janv. 1979
2.429 mds
+625.0 mln.
34.65%
1 janv. 1982
1.467 mds
-962.0 mln.
-39.6%
1 janv. 1983
1.689 mds
+222.0 mln.
15.13%
1 janv. 1984
1.428 mds
-261.0 mln.
-15.45%
1 janv. 1985
1.233 mds
-195.0 mln.
-13.66%
1 janv. 1986
1.733 mds
+500.0 mln.
40.55%
1 janv. 1987
2.22 mds
+487.0 mln.
28.1%
1 janv. 2013
1.118 mds
-1.102 mds
-49.64%
1 janv. 2014
618.0 mln.
-500.0 mln.
-44.72%
Classement des pays selon les statistiques actuelles par années

Commentaires:

Envoyer
PremiumAbout & FeedbackUn accordConfidentialité
logo
© 2022 Selected Technologies LLC – Morgan Hill, California