33
/fr/
AIzaSyB4mHJ5NPEv-XzF7P6NDYXjlkCWaeKw5bc
November 30, 2025
285531
Zambia
ZMB
true
2
1
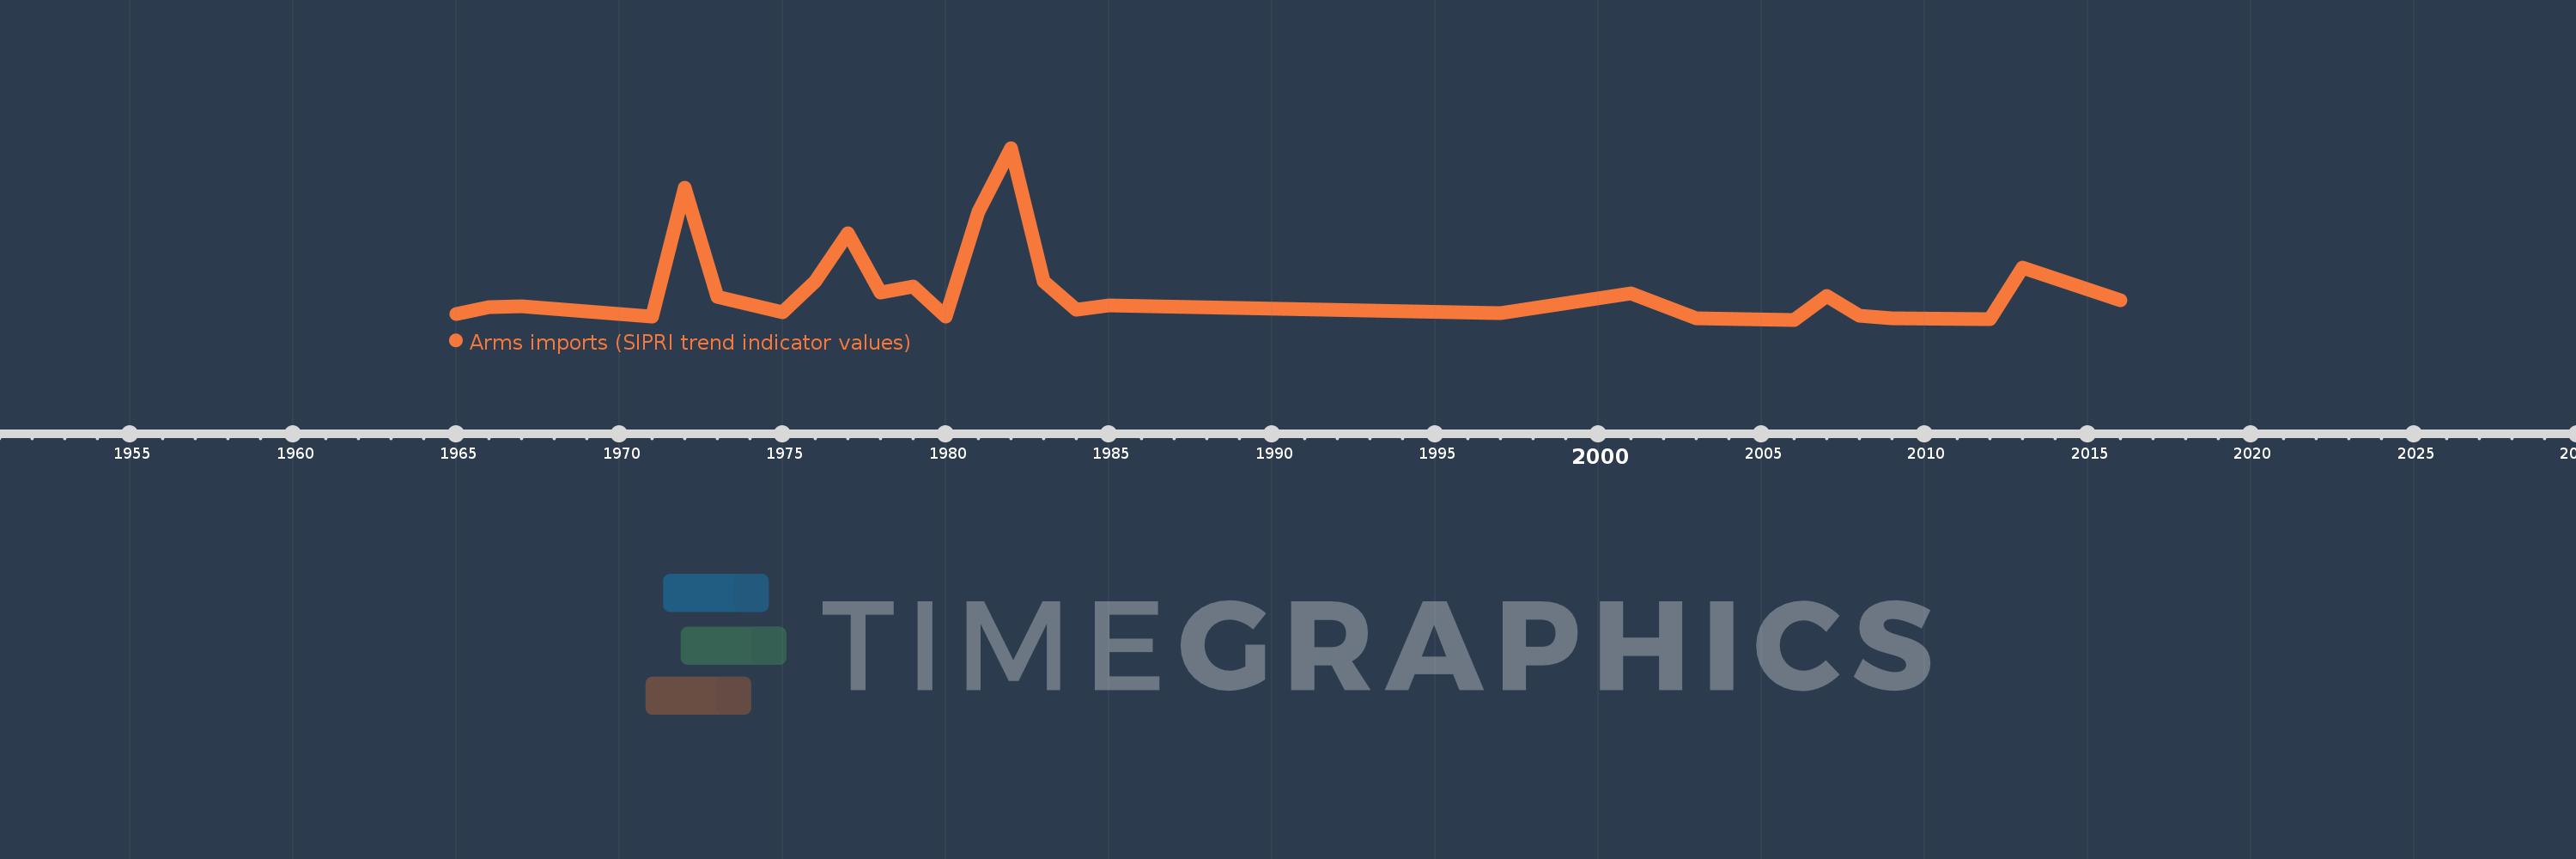
Arms imports (SIPRI trend indicator values)
2016,2013,2012,2009,2008,2007,2006,2003,2001,1997,1985,1984,1983,1982,1981,1980,1979,1978,1977,1976,1975,1974,1973,1972,1971,1970,1967,1966,1965