33
/fr/
AIzaSyB4mHJ5NPEv-XzF7P6NDYXjlkCWaeKw5bc
November 30, 2025
271889
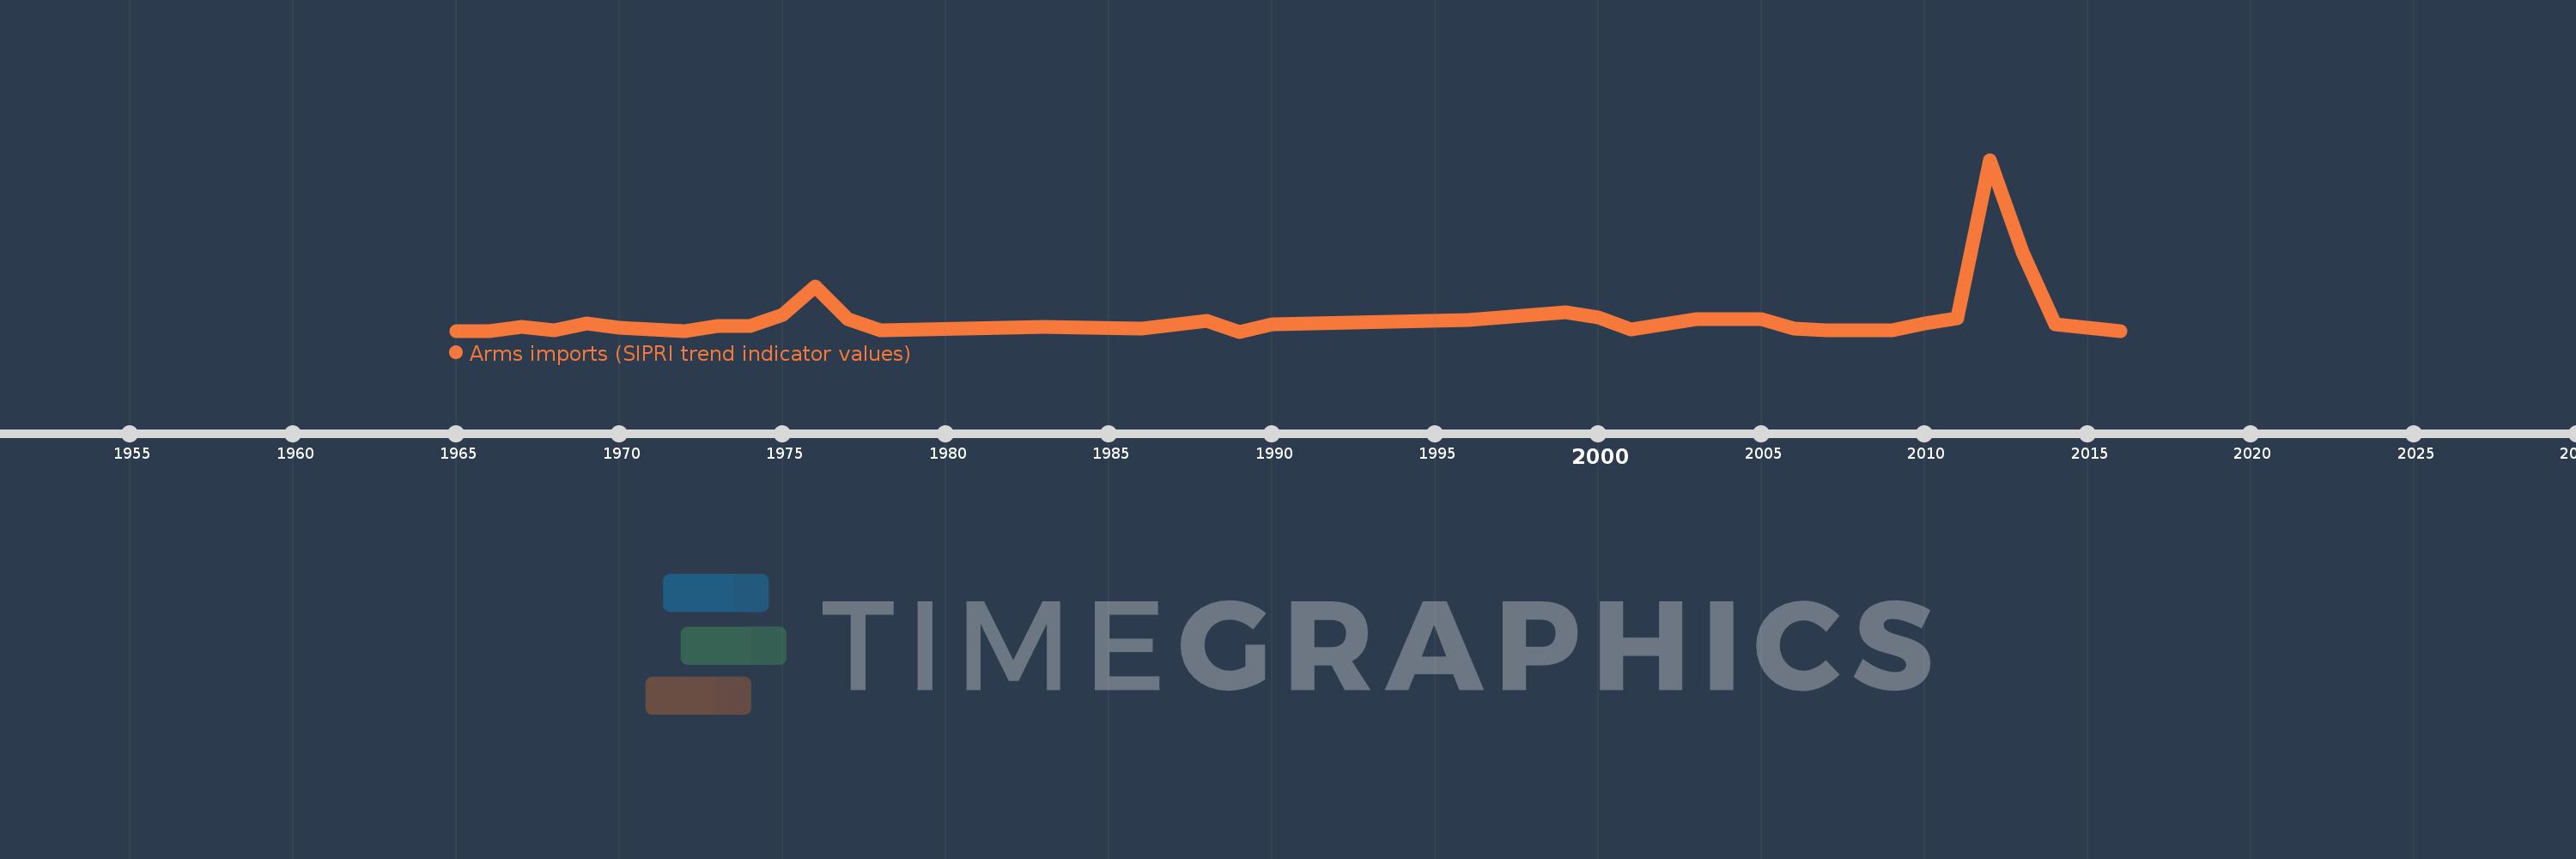
Uganda
UGA
true
2
1
Arms imports (SIPRI trend indicator values)
2016,2014,2013,2012,2011,2010,2009,2007,2006,2005,2003,2001,2000,1999,1996,1990,1989,1988,1986,1983,1978,1977,1976,1975,1974,1973,1972,1971,1970,1969,1968,1967,1966,1965