29
/fr/
fr
AIzaSyAYiBZKx7MnpbEhh9jyipgxe19OcubqV5w
April 1, 2024
206406
Nepal
NPL
true
2
1
Arms imports (SIPRI trend indicator values)
2016,2015,2012,2009,2006,2005,2004,2003,2002,1996,1993,1990,1986,1985,1982,1977,1976,1975,1974,1973,1972,1971,1967,1966
Download
Bibliothèque de statistiques globales →Nepal →

Arms imports (SIPRI trend indicator values)

Cette statistique dans les autres pays:
AfghanistanAlbaniaAlgeriaAngolaArab WorldArgentinaArmeniaAustraliaAustriaAzerbaijanBahamas, TheBahrainBangladeshBarbadosBelarusBelgiumBelizeBeninBhutanBoliviaBosnia and HerzegovinaBotswanaBrazilBrunei DarussalamBulgariaBurkina FasoBurundiCabo VerdeCambodiaCameroonCanadaCaribbean small statesCentral African RepublicCentral Europe and the BalticsChadChileChinaColombiaComorosCongo, Dem. Rep.Congo, Rep.Costa RicaCote d'IvoireCroatiaCubaCyprusCzech RepublicDenmarkDjiboutiDominican RepublicEarly-demographic dividendEast Asia & PacificEast Asia & Pacific (excluding high income)East Asia & Pacific (IDA & IBRD countries)EcuadorEgypt, Arab Rep.El SalvadorEquatorial GuineaEritreaEstoniaEthiopiaEuro areaEurope & Central AsiaEurope & Central Asia (excluding high income)Europe & Central Asia (IDA & IBRD countries)European UnionFijiFinlandFragile and conflict affected situationsFranceGabonGambia, TheGeorgiaGermanyGhanaGreeceGrenadaGuatemalaGuineaGuinea-BissauGuyanaHaitiHeavily indebted poor countries (HIPC)High incomeHondurasHungaryIBRD onlyIcelandIDA & IBRD totalIDA blendIDA onlyIDA totalIndiaIndonesiaIran, Islamic Rep.IraqIrelandIsraelItalyJamaicaJapanJordanKazakhstanKenyaKiribatiKorea, Dem. People’s Rep.Korea, Rep.KosovoKuwaitKyrgyz RepublicLao PDRLate-demographic dividendLatin America & Caribbean Latin America & Caribbean (excluding high income)Latin America & the Caribbean (IDA & IBRD countries)LatviaLeast developed countries: UN classificationLebanonLesothoLiberiaLibyaLithuaniaLow & middle incomeLow incomeLower middle incomeLuxembourgMacedonia, FYRMadagascarMalawiMalaysiaMaldivesMaliMaltaMarshall IslandsMauritaniaMauritiusMexicoMicronesia, Fed. Sts.Middle East & North AfricaMiddle East & North Africa (excluding high income)Middle East & North Africa (IDA & IBRD countries)Middle incomeMoldovaMongoliaMoroccoMozambiqueMyanmarNamibiaNepalNetherlandsNew ZealandNicaraguaNigerNigeriaNorth AmericaNorwayOECD membersOmanOther small statesPacific island small statesPakistanPalauPanamaPapua New GuineaParaguayPeruPhilippinesPolandPortugalPost-demographic dividendPre-demographic dividendQatarRomaniaRussian FederationRwandaSamoaSaudi ArabiaSenegalSerbiaSeychellesSierra LeoneSingaporeSlovak RepublicSloveniaSmall statesSolomon IslandsSomaliaSouth AfricaSouth AsiaSouth Asia (IDA & IBRD)South SudanSpainSri LankaSt. Kitts and NevisSt. Vincent and the GrenadinesSub-Saharan Africa Sub-Saharan Africa (excluding high income)Sub-Saharan Africa (IDA & IBRD countries)SudanSurinameSwazilandSwedenSwitzerlandSyrian Arab RepublicTajikistanTanzaniaThailandTimor-LesteTogoTongaTrinidad and TobagoTunisiaTurkeyTurkmenistanTuvaluUgandaUkraineUnited Arab EmiratesUnited KingdomUnited StatesUpper middle incomeUruguayUzbekistanVanuatuVenezuela, RBVietnamWest Bank and GazaWorldYemen, Rep.ZambiaZimbabwe
La ligne de temps
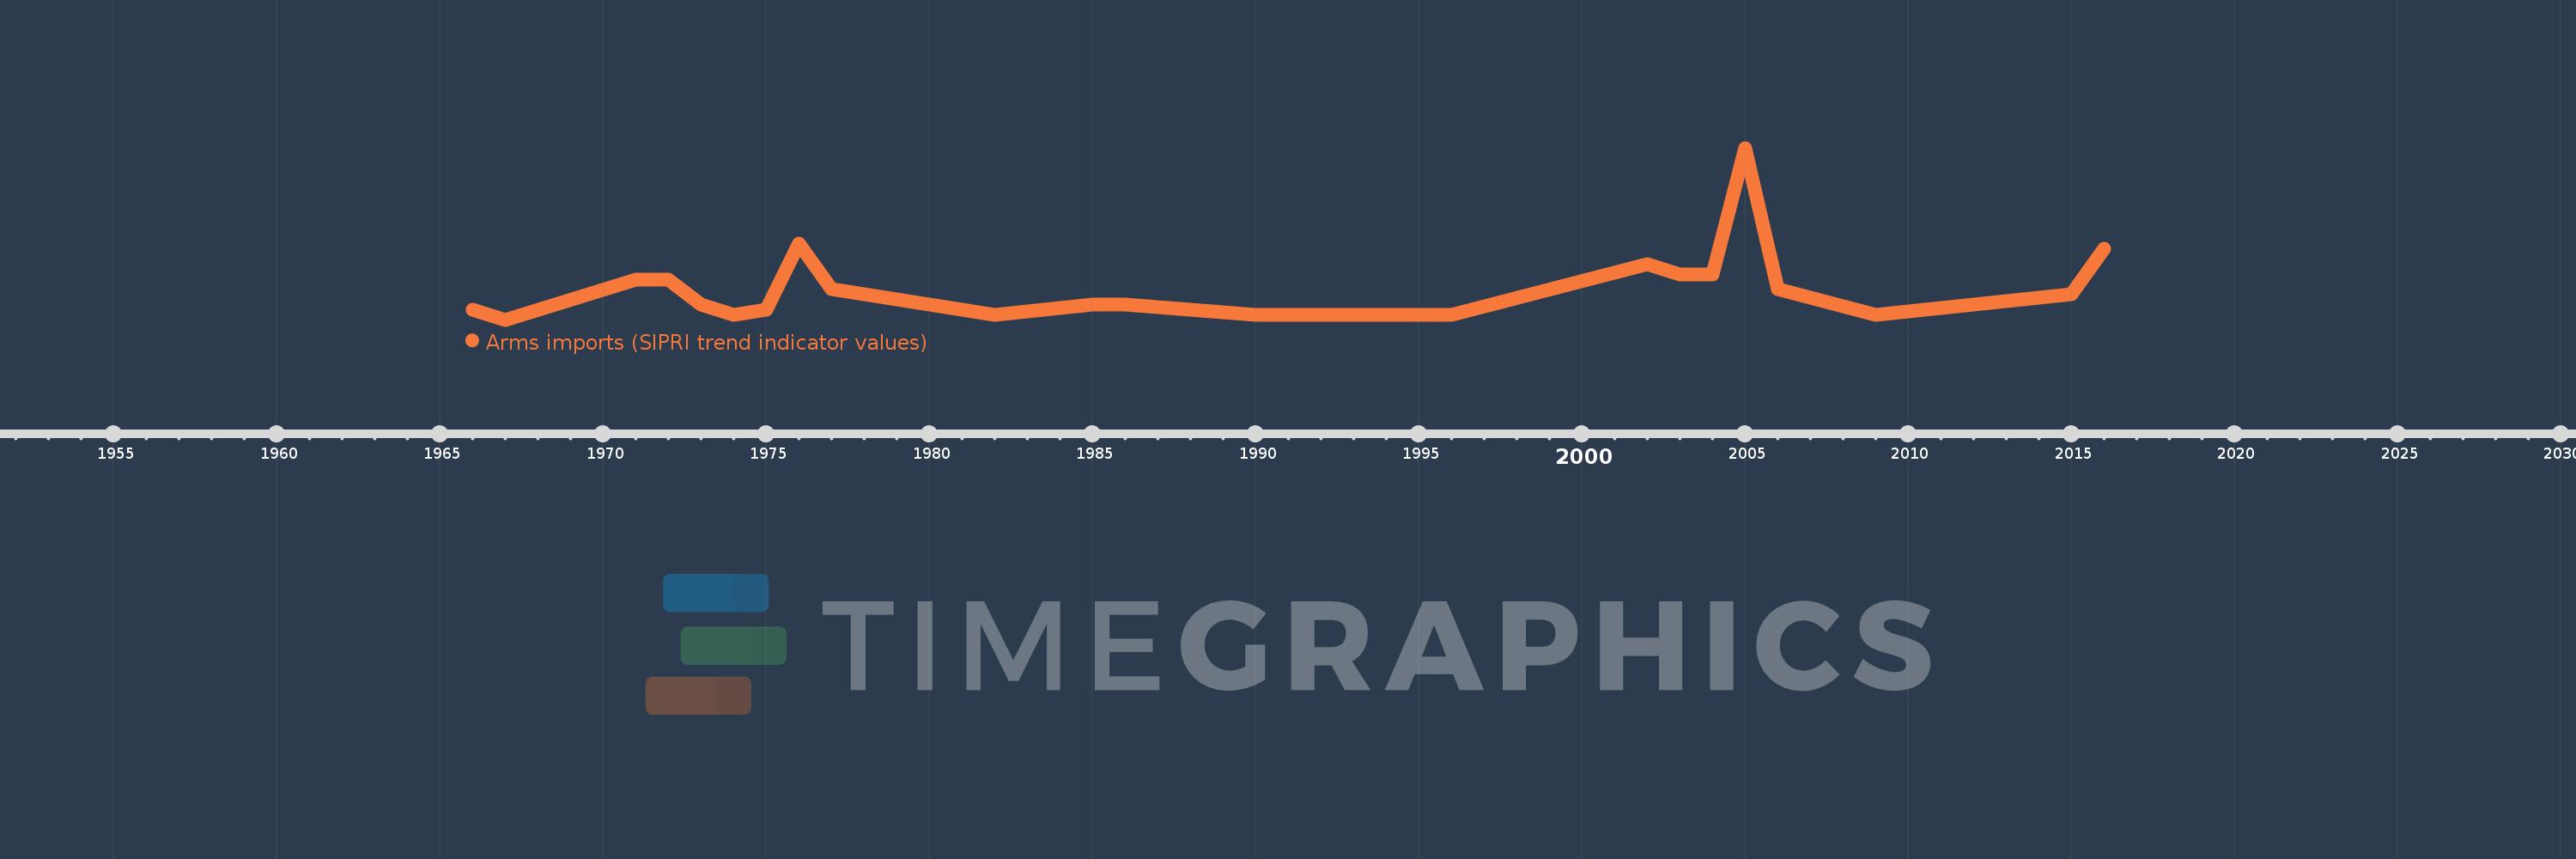
Cette échelle de temps montre un graphique de 1966 année à 2016 année Nepal. Les données jusqu'à 1965 année ne sont pas présentés. Quantité d'observations actuelles selon dates: 24.
Source (désignation):
Les indicateurs du développement mondiale
Source (organisation):
Stockholm International Peace Research Institute (SIPRI), Arms Transfers Programme (http://portal.sipri.org/publications/pages/transfer/splash).
Catégories:
Public Sector, Trade
Dernière mise à jour
23 avr. 2017
Les indicateurs de changement de valeurs selon les années
En moyenne:
6.125 mln.
Minimum:
0.0
1 janv. 1967
Maximum:
34.0 mln.
1 janv. 2005
Pour la date d''observation
Valeur
Changement absolu
Le changement par rapport à la valeur précédente
1 janv. 1966
2.0 mln.
+2.0 mln.
0.0%
1 janv. 1967
0.0
-2.0 mln.
-100.0%
1 janv. 1971
8.0 mln.
+8.0 mln.
%
1 janv. 1972
8.0 mln.
0.0
0.0%
1 janv. 1973
3.0 mln.
-5.0 mln.
-62.5%
1 janv. 1974
1000.0 milles
-2.0 mln.
-66.67%
1 janv. 1975
2.0 mln.
+1000.0 milles
100.0%
1 janv. 1976
15.0 mln.
+13.0 mln.
650.0%
1 janv. 1977
6.0 mln.
-9.0 mln.
-60.0%
1 janv. 1982
1000.0 milles
-5.0 mln.
-83.33%
1 janv. 1985
3.0 mln.
+2.0 mln.
200.0%
1 janv. 1986
3.0 mln.
0.0
0.0%
1 janv. 1990
1000.0 milles
-2.0 mln.
-66.67%
1 janv. 1993
1000.0 milles
0.0
0.0%
1 janv. 1996
1000.0 milles
0.0
0.0%
1 janv. 2002
11.0 mln.
+10.0 mln.
1000.0%
1 janv. 2003
9.0 mln.
-2.0 mln.
-18.18%
1 janv. 2004
9.0 mln.
0.0
0.0%
1 janv. 2005
34.0 mln.
+25.0 mln.
277.78%
1 janv. 2006
6.0 mln.
-28.0 mln.
-82.35%
1 janv. 2009
1000.0 milles
-5.0 mln.
-83.33%
1 janv. 2012
3.0 mln.
+2.0 mln.
200.0%
1 janv. 2015
5.0 mln.
+2.0 mln.
66.67%
1 janv. 2016
14.0 mln.
+9.0 mln.
180.0%
Classement des pays selon les statistiques actuelles par années

Commentaires:

Envoyer
PremiumAbout & FeedbackUn accordConfidentialité
logo
© 2022 Selected Technologies LLC – Morgan Hill, California