33
/fr/
AIzaSyB4mHJ5NPEv-XzF7P6NDYXjlkCWaeKw5bc
November 30, 2025
210010
Nicaragua
NIC
true
2
1
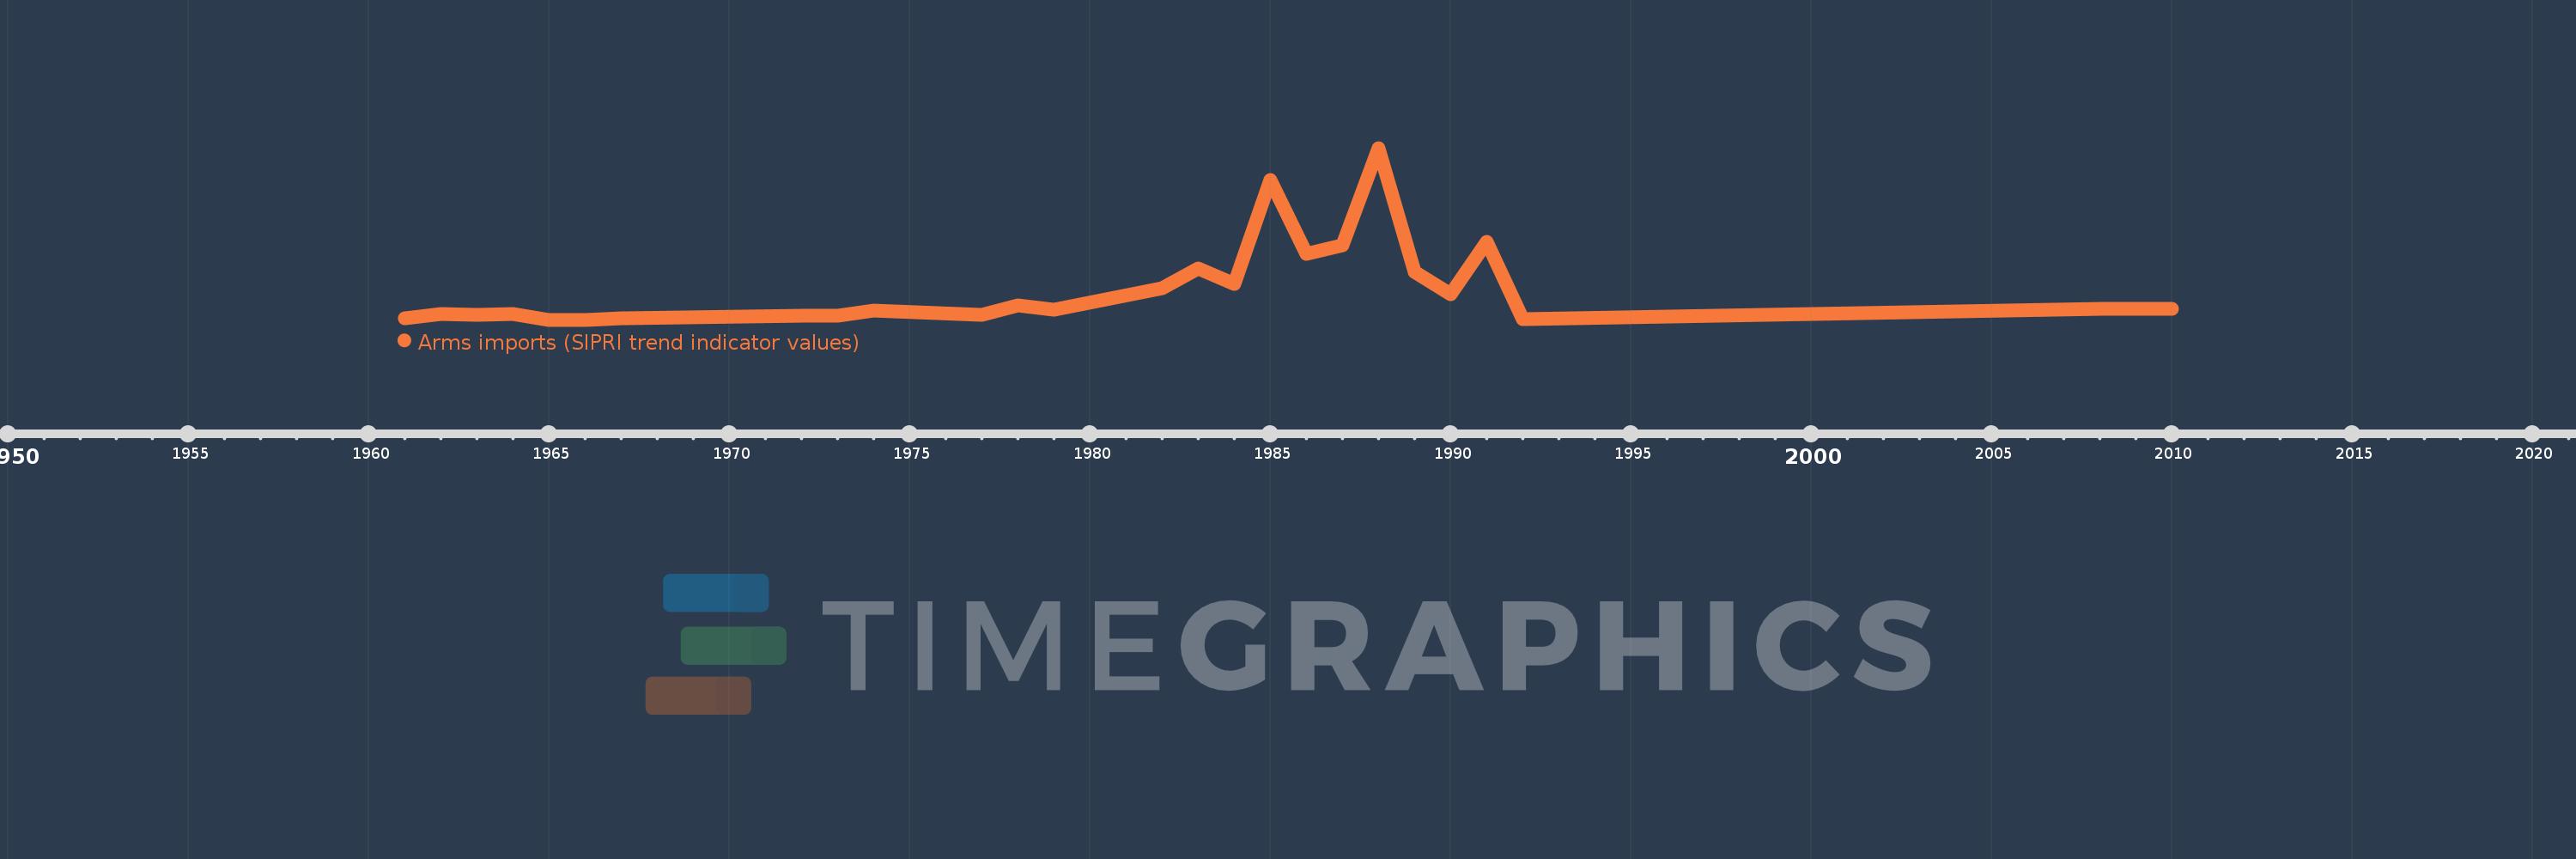
Arms imports (SIPRI trend indicator values)
2010,2008,1992,1991,1990,1989,1988,1987,1986,1985,1984,1983,1982,1979,1978,1977,1974,1973,1972,1967,1966,1965,1964,1963,1962,1961