33
/fr/
AIzaSyB4mHJ5NPEv-XzF7P6NDYXjlkCWaeKw5bc
November 1, 2025
235378
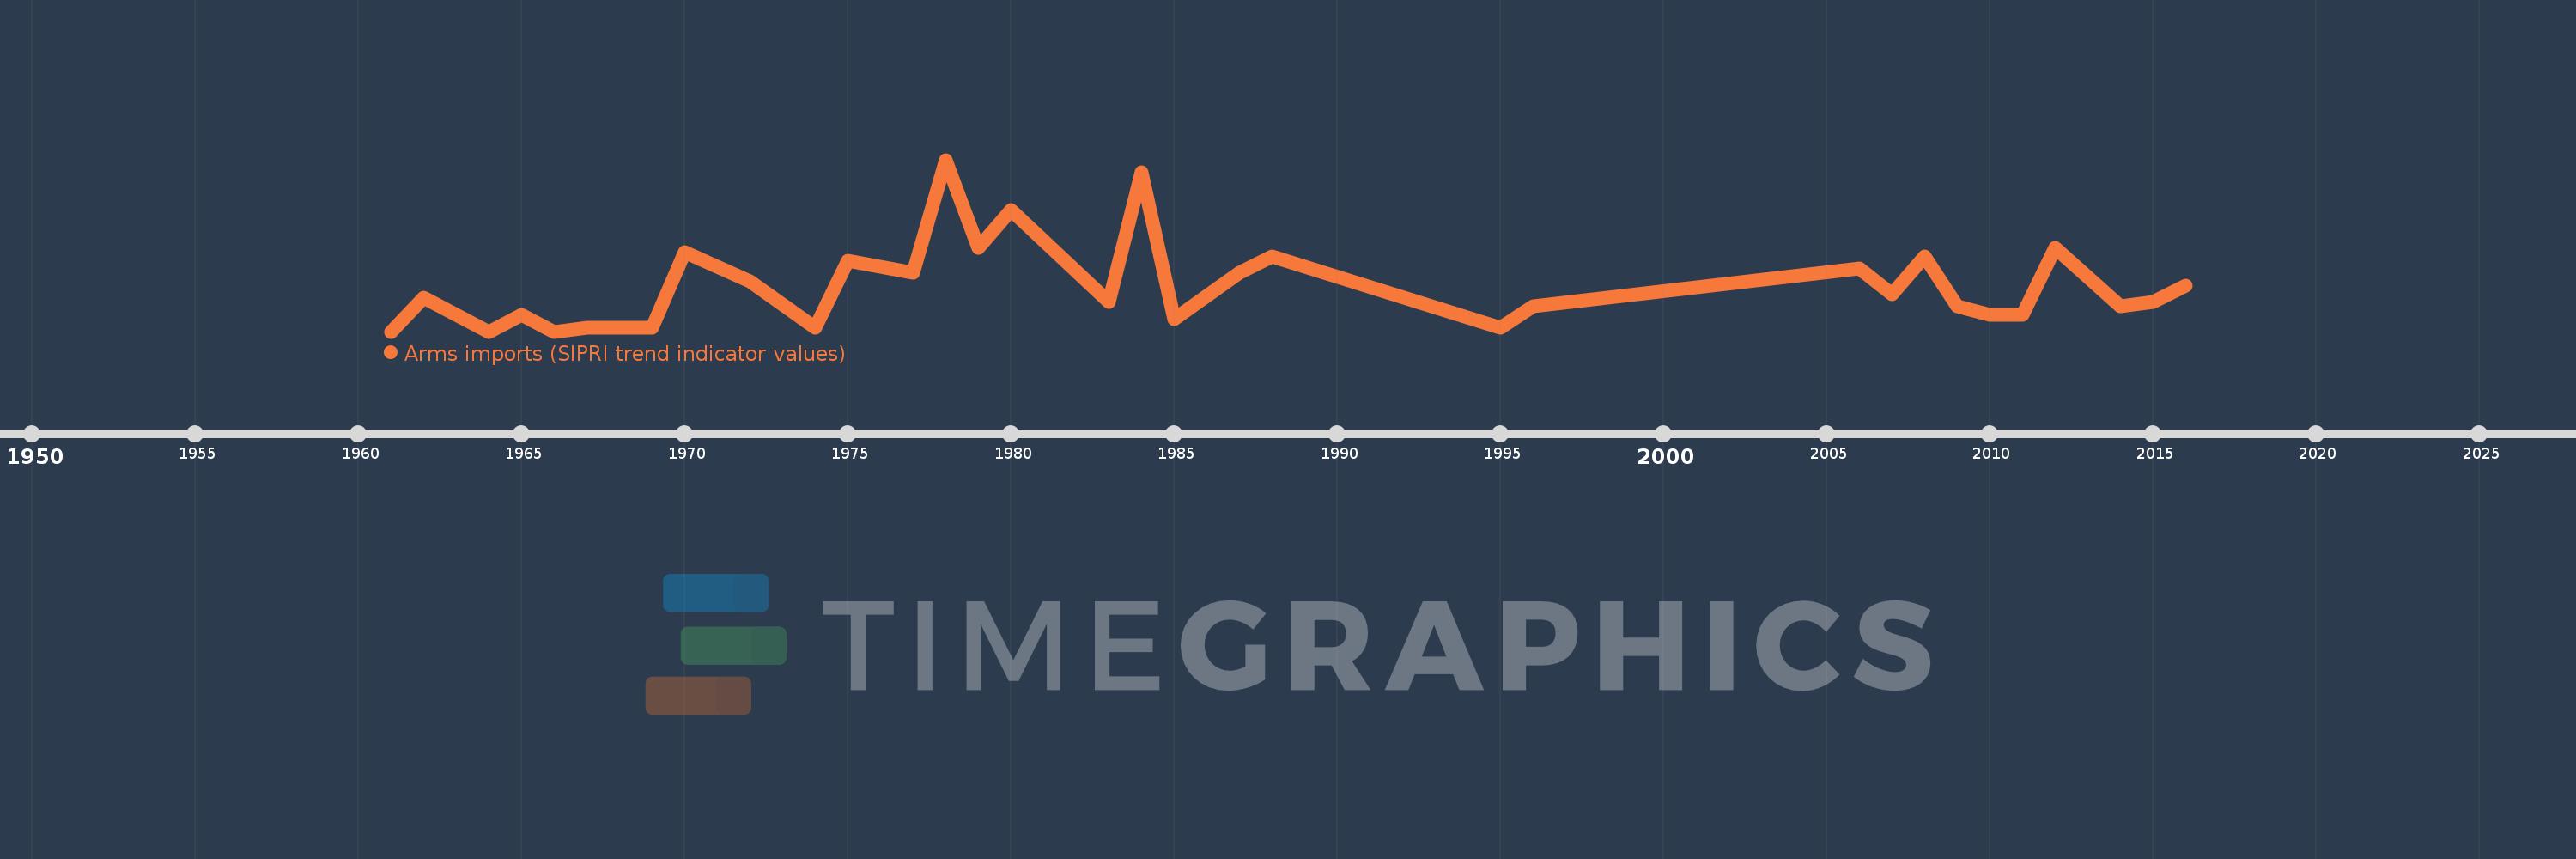
Senegal
SEN
true
2
1
Arms imports (SIPRI trend indicator values)
2016,2015,2014,2012,2011,2010,2009,2008,2007,2006,1996,1995,1988,1987,1985,1984,1983,1980,1979,1978,1977,1975,1974,1972,1970,1969,1967,1966,1965,1964,1962,1961