29
/
en
AIzaSyAYiBZKx7MnpbEhh9jyipgxe19OcubqV5w
April 1, 2024
97259
Cabo Verde
CPV
true
2
1
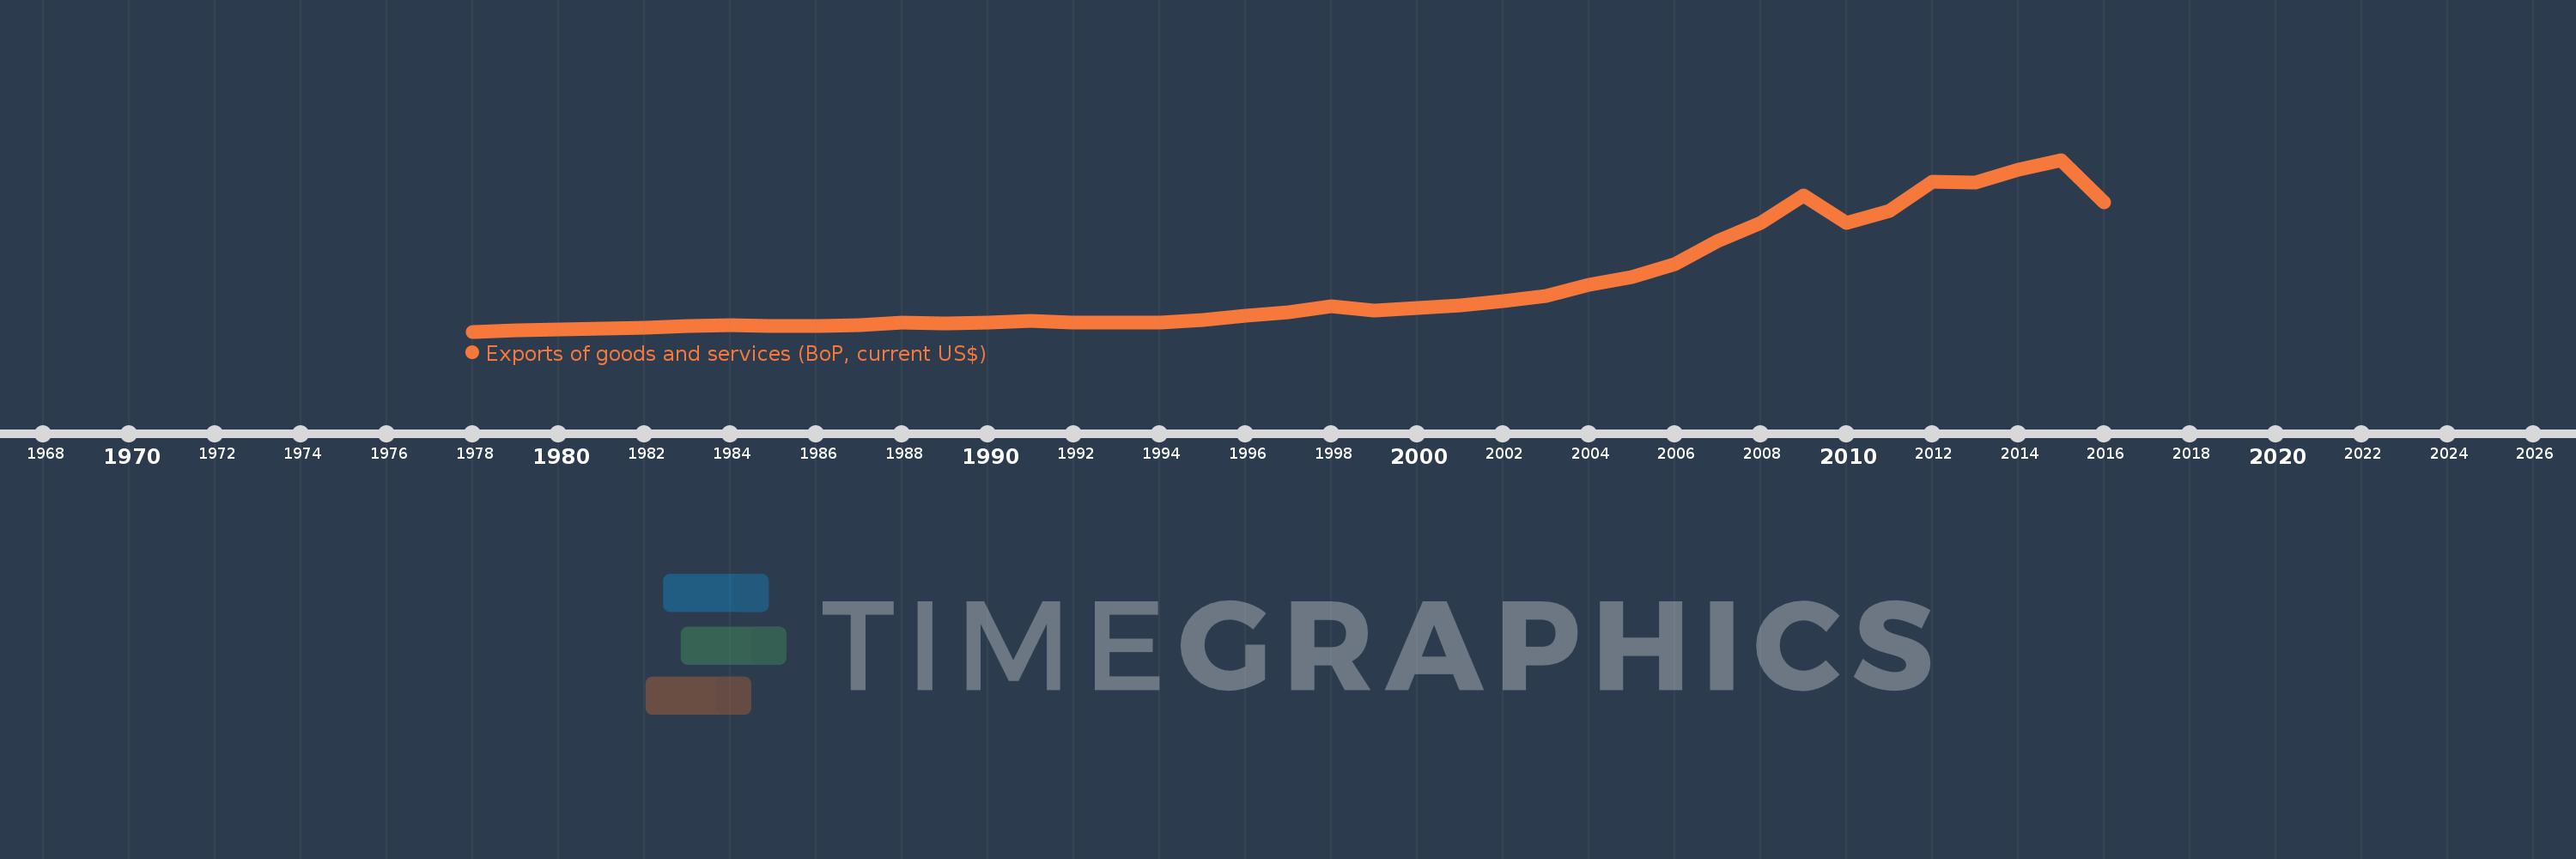
Exports of goods and services (BoP, current US$)
2016,2015,2014,2013,2012,2011,2010,2009,2008,2007,2006,2005,2004,2003,2002,2001,2000,1999,1998,1997,1996,1995,1994,1993,1992,1991,1990,1989,1988,1987,1986,1985,1984,1983,1982,1981,1980,1979,1978
This statistics in other country:
AfghanistanAlbaniaAlgeriaAngolaAntigua and BarbudaArab WorldArgentinaArmeniaArubaAustraliaAustriaAzerbaijanBahamas, TheBahrainBangladeshBarbadosBelarusBelgiumBelizeBeninBermudaBhutanBoliviaBosnia and HerzegovinaBotswanaBrazilBrunei DarussalamBulgariaBurkina FasoBurundiCabo VerdeCambodiaCameroonCanadaCaribbean small statesCentral African RepublicCentral Europe and the BalticsChadChileChinaColombiaComorosCongo, Dem. Rep.Congo, Rep.Costa RicaCote d'IvoireCroatiaCuracaoCyprusCzech RepublicDenmarkDjiboutiDominicaDominican RepublicEarly-demographic dividendEast Asia & PacificEast Asia & Pacific (excluding high income)East Asia & Pacific (IDA & IBRD countries)EcuadorEgypt, Arab Rep.El SalvadorEquatorial GuineaEritreaEstoniaEthiopiaEuro areaEurope & Central AsiaEurope & Central Asia (excluding high income)Europe & Central Asia (IDA & IBRD countries)European UnionFaroe IslandsFijiFinlandFragile and conflict affected situationsFranceFrench PolynesiaGabonGambia, TheGeorgiaGermanyGhanaGreeceGrenadaGuatemalaGuineaGuinea-BissauGuyanaHaitiHeavily indebted poor countries (HIPC)High incomeHondurasHong Kong SAR, ChinaHungaryIBRD onlyIcelandIDA & IBRD totalIDA blendIDA onlyIDA totalIndiaIndonesiaIran, Islamic Rep.IraqIrelandIsraelItalyJamaicaJapanJordanKazakhstanKenyaKiribatiKorea, Rep.KosovoKuwaitKyrgyz RepublicLao PDRLate-demographic dividendLatin America & Caribbean Latin America & Caribbean (excluding high income)Latin America & the Caribbean (IDA & IBRD countries)LatviaLeast developed countries: UN classificationLebanonLesothoLiberiaLibyaLithuaniaLow & middle incomeLow incomeLower middle incomeLuxembourgMacao SAR, ChinaMacedonia, FYRMadagascarMalawiMalaysiaMaldivesMaliMaltaMarshall IslandsMauritaniaMauritiusMexicoMicronesia, Fed. Sts.Middle East & North Africa (excluding high income)Middle East & North Africa (IDA & IBRD countries)Middle incomeMoldovaMongoliaMontenegroMoroccoMozambiqueMyanmarNamibiaNepalNetherlandsNew CaledoniaNicaraguaNigerNigeriaNorth AmericaNorwayOECD membersOmanPacific island small statesPakistanPalauPanamaPapua New GuineaParaguayPeruPhilippinesPolandPortugalPost-demographic dividendPre-demographic dividendQatarRomaniaRussian FederationRwandaSamoaSao Tome and PrincipeSaudi ArabiaSenegalSerbiaSeychellesSierra LeoneSingaporeSint Maarten (Dutch part)Slovak RepublicSloveniaSolomon IslandsSouth AfricaSouth AsiaSouth Asia (IDA & IBRD)South SudanSpainSri LankaSt. Kitts and NevisSt. LuciaSt. Vincent and the GrenadinesSub-Saharan Africa Sub-Saharan Africa (excluding high income)Sub-Saharan Africa (IDA & IBRD countries)SudanSurinameSwazilandSwedenSwitzerlandSyrian Arab RepublicTajikistanTanzaniaThailandTimor-LesteTogoTongaTrinidad and TobagoTunisiaTurkeyTuvaluUgandaUkraineUnited KingdomUnited StatesUpper middle incomeUruguayVanuatuVenezuela, RBVietnamWest Bank and GazaWorldYemen, Rep.ZambiaZimbabwe Timeline:
This timeline shows a graph from 1978 to 2016 of Cabo Verde. No data until 1977. Number of actual observations by date: 39.
Source name:
World Development Indicators
Source organization:
International Monetary Fund, Balance of Payments Statistics Yearbook and data files.
Categories, topics:
Economy & Growth, Trade
Last updated:
apr 23, 2017
Indicators value changes by year
Minimum:
2.2 mln
jan 1, 1978
Maximum:
893.33 mln
jan 1, 2015
At the date of observation
Value
Absolute change
Change from previous value
jan 1, 1978
2.2 mln
+2.2 mln
0.0%
jan 1, 1979
7.755 mln
+5.555 mln
252.5%
jan 1, 1980
12.318 mln
+4.563 mln
58.84%
jan 1, 1981
19.194 mln
+6.876 mln
55.82%
jan 1, 1982
23.649 mln
+4.456 mln
23.22%
jan 1, 1983
31.427 mln
+7.778 mln
32.89%
jan 1, 1984
36.784 mln
+5.357 mln
17.05%
jan 1, 1985
30.661 mln
-6.124 mln
-16.65%
jan 1, 1986
30.936 mln
+275.304K
0.9%
jan 1, 1987
36.257 mln
+5.321 mln
17.2%
jan 1, 1988
46.835 mln
+10.578 mln
29.18%
jan 1, 1989
43.101 mln
-3.734 mln
-7.97%
jan 1, 1990
49.883 mln
+6.782 mln
15.73%
jan 1, 1991
56.838 mln
+6.955 mln
13.94%
jan 1, 1992
48.139 mln
-8.699 mln
-15.3%
jan 1, 1993
50.699 mln
+2.56 mln
5.32%
jan 1, 1994
49.145 mln
-1.554 mln
-3.06%
jan 1, 1995
61.175 mln
+12.031 mln
24.48%
jan 1, 1996
83.482 mln
+22.307 mln
36.46%
jan 1, 1997
101.396 mln
+17.914 mln
21.46%
jan 1, 1998
134.545 mln
+33.15 mln
32.69%
jan 1, 1999
113.053 mln
-21.492 mln
-15.97%
jan 1, 2000
123.136 mln
+10.083 mln
8.92%
jan 1, 2001
136.287 mln
+13.151 mln
10.68%
jan 1, 2002
160.147 mln
+23.86 mln
17.51%
jan 1, 2003
186.703 mln
+26.556 mln
16.58%
jan 1, 2004
246.009 mln
+59.306 mln
31.76%
jan 1, 2005
285.419 mln
+39.41 mln
16.02%
jan 1, 2006
353.783 mln
+68.364 mln
23.95%
jan 1, 2007
472.295 mln
+118.512 mln
33.5%
jan 1, 2008
566.026 mln
+93.731 mln
19.85%
jan 1, 2009
710.489 mln
+144.463 mln
25.52%
jan 1, 2010
567.365 mln
-143.124 mln
-20.14%
jan 1, 2011
629.768 mln
+62.404 mln
11.0%
jan 1, 2012
781.866 mln
+152.098 mln
24.15%
jan 1, 2013
775.701 mln
-6.166 mln
-0.79%
jan 1, 2014
841.492 mln
+65.792 mln
8.48%
jan 1, 2015
893.33 mln
+51.838 mln
6.16%
jan 1, 2016
673.654 mln
-219.676 mln
-24.59%
Ranking of countries by current statistics by years


Comments: