29
/
en
AIzaSyAYiBZKx7MnpbEhh9jyipgxe19OcubqV5w
April 1, 2024
285826
Zambia
ZMB
true
2
1
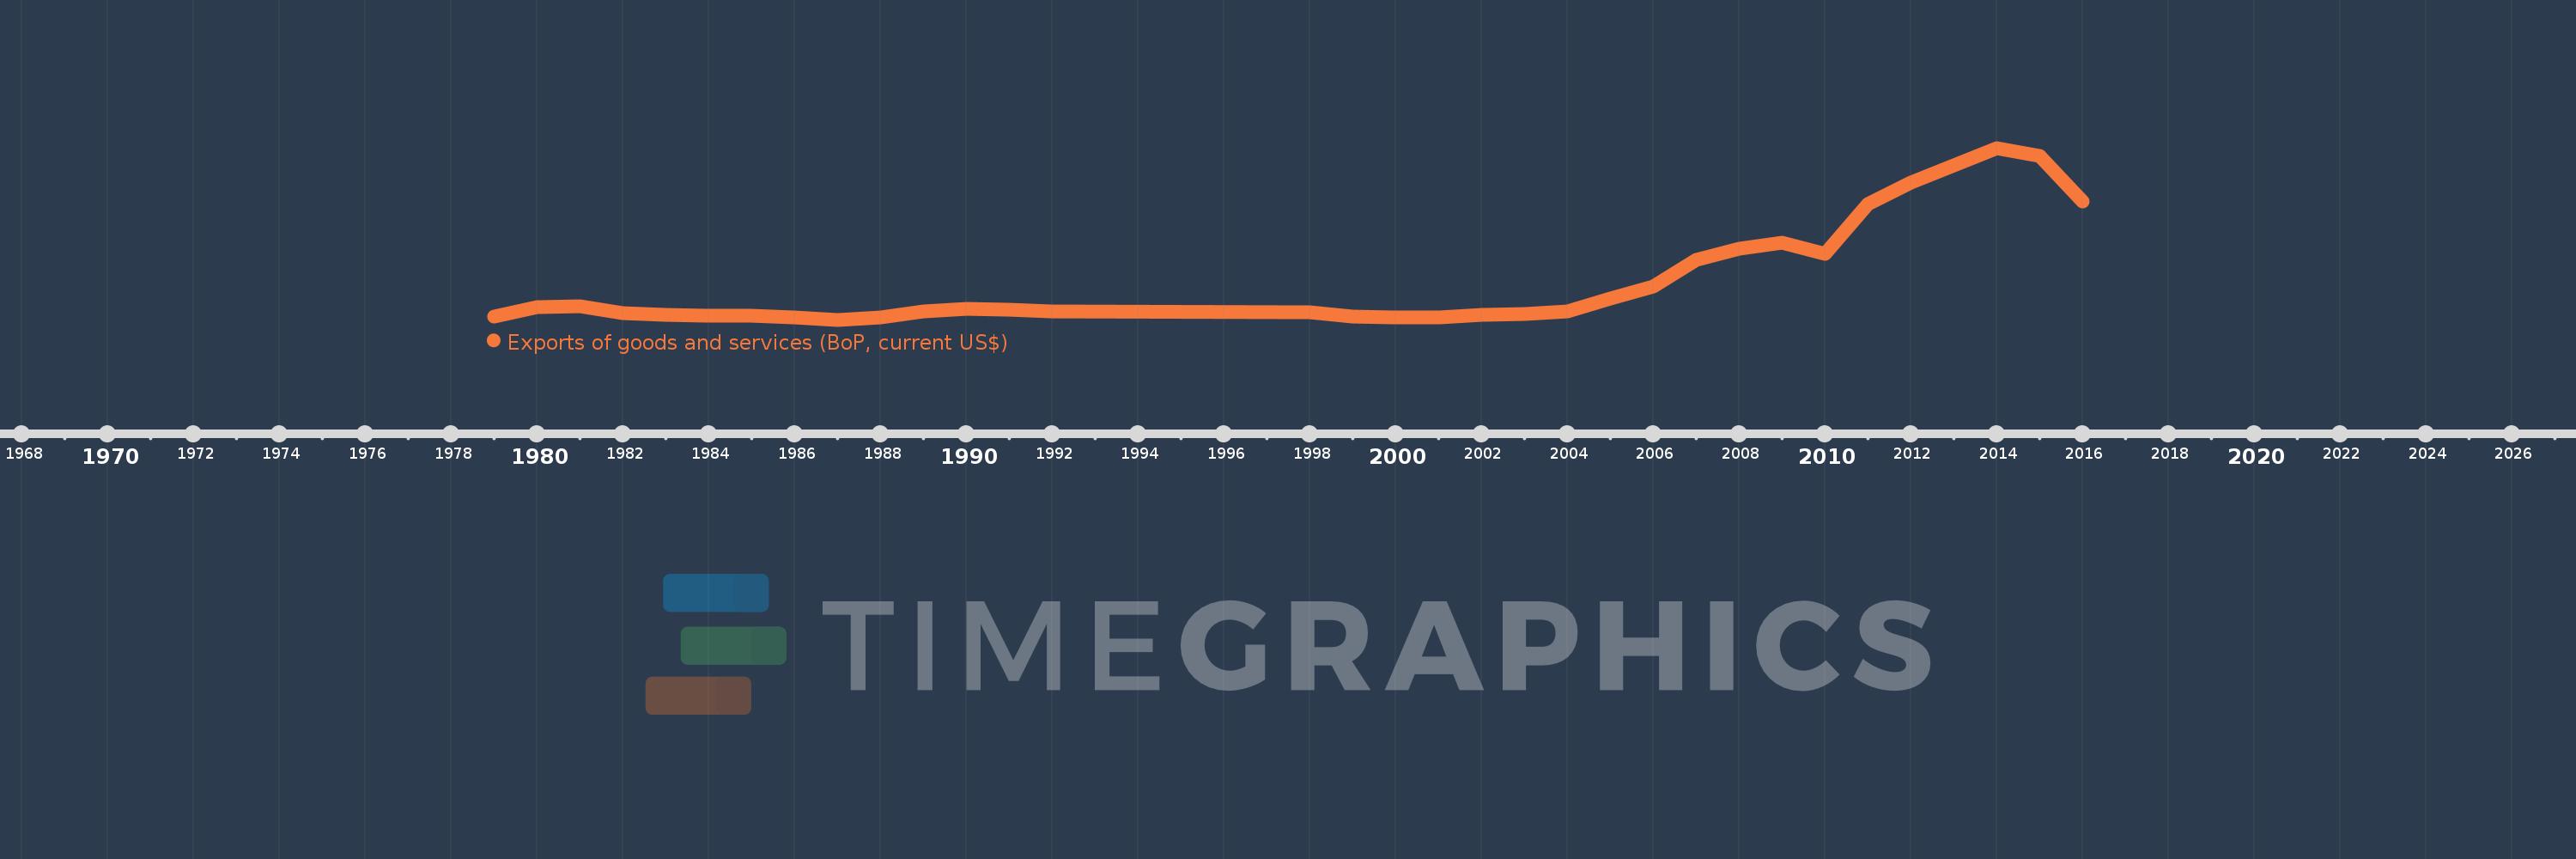
Exports of goods and services (BoP, current US$)
2016,2015,2014,2013,2012,2011,2010,2009,2008,2007,2006,2005,2004,2003,2002,2001,2000,1999,1998,1992,1991,1990,1989,1988,1987,1986,1985,1984,1983,1982,1981,1980,1979
This statistics in other country:
AfghanistanAlbaniaAlgeriaAngolaAntigua and BarbudaArab WorldArgentinaArmeniaArubaAustraliaAustriaAzerbaijanBahamas, TheBahrainBangladeshBarbadosBelarusBelgiumBelizeBeninBermudaBhutanBoliviaBosnia and HerzegovinaBotswanaBrazilBrunei DarussalamBulgariaBurkina FasoBurundiCabo VerdeCambodiaCameroonCanadaCaribbean small statesCentral African RepublicCentral Europe and the BalticsChadChileChinaColombiaComorosCongo, Dem. Rep.Congo, Rep.Costa RicaCote d'IvoireCroatiaCuracaoCyprusCzech RepublicDenmarkDjiboutiDominicaDominican RepublicEarly-demographic dividendEast Asia & PacificEast Asia & Pacific (excluding high income)East Asia & Pacific (IDA & IBRD countries)EcuadorEgypt, Arab Rep.El SalvadorEquatorial GuineaEritreaEstoniaEthiopiaEuro areaEurope & Central AsiaEurope & Central Asia (excluding high income)Europe & Central Asia (IDA & IBRD countries)European UnionFaroe IslandsFijiFinlandFragile and conflict affected situationsFranceFrench PolynesiaGabonGambia, TheGeorgiaGermanyGhanaGreeceGrenadaGuatemalaGuineaGuinea-BissauGuyanaHaitiHeavily indebted poor countries (HIPC)High incomeHondurasHong Kong SAR, ChinaHungaryIBRD onlyIcelandIDA & IBRD totalIDA blendIDA onlyIDA totalIndiaIndonesiaIran, Islamic Rep.IraqIrelandIsraelItalyJamaicaJapanJordanKazakhstanKenyaKiribatiKorea, Rep.KosovoKuwaitKyrgyz RepublicLao PDRLate-demographic dividendLatin America & Caribbean Latin America & Caribbean (excluding high income)Latin America & the Caribbean (IDA & IBRD countries)LatviaLeast developed countries: UN classificationLebanonLesothoLiberiaLibyaLithuaniaLow & middle incomeLow incomeLower middle incomeLuxembourgMacao SAR, ChinaMacedonia, FYRMadagascarMalawiMalaysiaMaldivesMaliMaltaMarshall IslandsMauritaniaMauritiusMexicoMicronesia, Fed. Sts.Middle East & North Africa (excluding high income)Middle East & North Africa (IDA & IBRD countries)Middle incomeMoldovaMongoliaMontenegroMoroccoMozambiqueMyanmarNamibiaNepalNetherlandsNew CaledoniaNicaraguaNigerNigeriaNorth AmericaNorwayOECD membersOmanPacific island small statesPakistanPalauPanamaPapua New GuineaParaguayPeruPhilippinesPolandPortugalPost-demographic dividendPre-demographic dividendQatarRomaniaRussian FederationRwandaSamoaSao Tome and PrincipeSaudi ArabiaSenegalSerbiaSeychellesSierra LeoneSingaporeSint Maarten (Dutch part)Slovak RepublicSloveniaSolomon IslandsSouth AfricaSouth AsiaSouth Asia (IDA & IBRD)South SudanSpainSri LankaSt. Kitts and NevisSt. LuciaSt. Vincent and the GrenadinesSub-Saharan Africa Sub-Saharan Africa (excluding high income)Sub-Saharan Africa (IDA & IBRD countries)SudanSurinameSwazilandSwedenSwitzerlandSyrian Arab RepublicTajikistanTanzaniaThailandTimor-LesteTogoTongaTrinidad and TobagoTunisiaTurkeyTuvaluUgandaUkraineUnited KingdomUnited StatesUpper middle incomeUruguayVanuatuVenezuela, RBVietnamWest Bank and GazaWorldYemen, Rep.ZambiaZimbabwe Timeline:
This timeline shows a graph from 1979 to 2016 of Zambia. No data until 1978. Number of actual observations by date: 33.
Source name:
World Development Indicators
Source organization:
International Monetary Fund, Balance of Payments Statistics Yearbook and data files.
Categories, topics:
Economy & Growth, Trade
Last updated:
apr 23, 2017
Indicators value changes by year
Minimum:
739.5 mln
jan 1, 1987
Maximum:
11.601 bln
jan 1, 2014
At the date of observation
Value
Absolute change
Change from previous value
jan 1, 1979
943.4 mln
+943.4 mln
0.0%
jan 1, 1980
1.523 bln
+579.9 mln
61.47%
jan 1, 1981
1.609 bln
+85.4 mln
5.61%
jan 1, 1982
1.149 bln
-459.7 mln
-28.58%
jan 1, 1983
1.064 bln
-85.3 mln
-7.42%
jan 1, 1984
1.022 bln
-42.0 mln
-3.95%
jan 1, 1985
968.1 mln
-53.6 mln
-5.25%
jan 1, 1986
865.1 mln
-103.0 mln
-10.64%
jan 1, 1987
739.5 mln
-125.6 mln
-14.52%
jan 1, 1988
899.8 mln
+160.3 mln
21.68%
jan 1, 1989
1.248 bln
+347.8 mln
38.65%
jan 1, 1990
1.425 bln
+177.7 mln
14.24%
jan 1, 1991
1.36 bln
-65.0 mln
-4.56%
jan 1, 1992
1.255 bln
-105.2 mln
-7.73%
jan 1, 1998
1.222 bln
-32.8 mln
-2.61%
jan 1, 1999
916.8 mln
-305.5 mln
-24.99%
jan 1, 2000
878.6 mln
-38.2 mln
-4.17%
jan 1, 2001
871.97 mln
-6.63 mln
-0.75%
jan 1, 2002
1.055 bln
+182.855 mln
20.97%
jan 1, 2003
1.104 bln
+49.644 mln
4.71%
jan 1, 2004
1.252 bln
+147.048 mln
13.31%
jan 1, 2005
2.076 bln
+824.789 mln
65.9%
jan 1, 2006
2.828 bln
+751.389 mln
36.19%
jan 1, 2007
4.547 bln
+1.719 bln
60.81%
jan 1, 2008
5.227 bln
+680.057 mln
14.96%
jan 1, 2009
5.632 bln
+404.516 mln
7.74%
jan 1, 2010
4.9 bln
-731.205 mln
-12.98%
jan 1, 2011
8.054 bln
+3.154 bln
64.36%
jan 1, 2012
9.419 bln
+1.365 bln
16.94%
jan 1, 2013
10.511 bln
+1.092 bln
11.59%
jan 1, 2014
11.601 bln
+1.091 bln
10.38%
jan 1, 2015
11.071 bln
-530.376 mln
-4.57%
jan 1, 2016
8.223 bln
-2.848 bln
-25.72%
Ranking of countries by current statistics by years


Comments: