29
/
en
AIzaSyAYiBZKx7MnpbEhh9jyipgxe19OcubqV5w
April 1, 2024
61555
Upper middle income
UMC
false
2
1
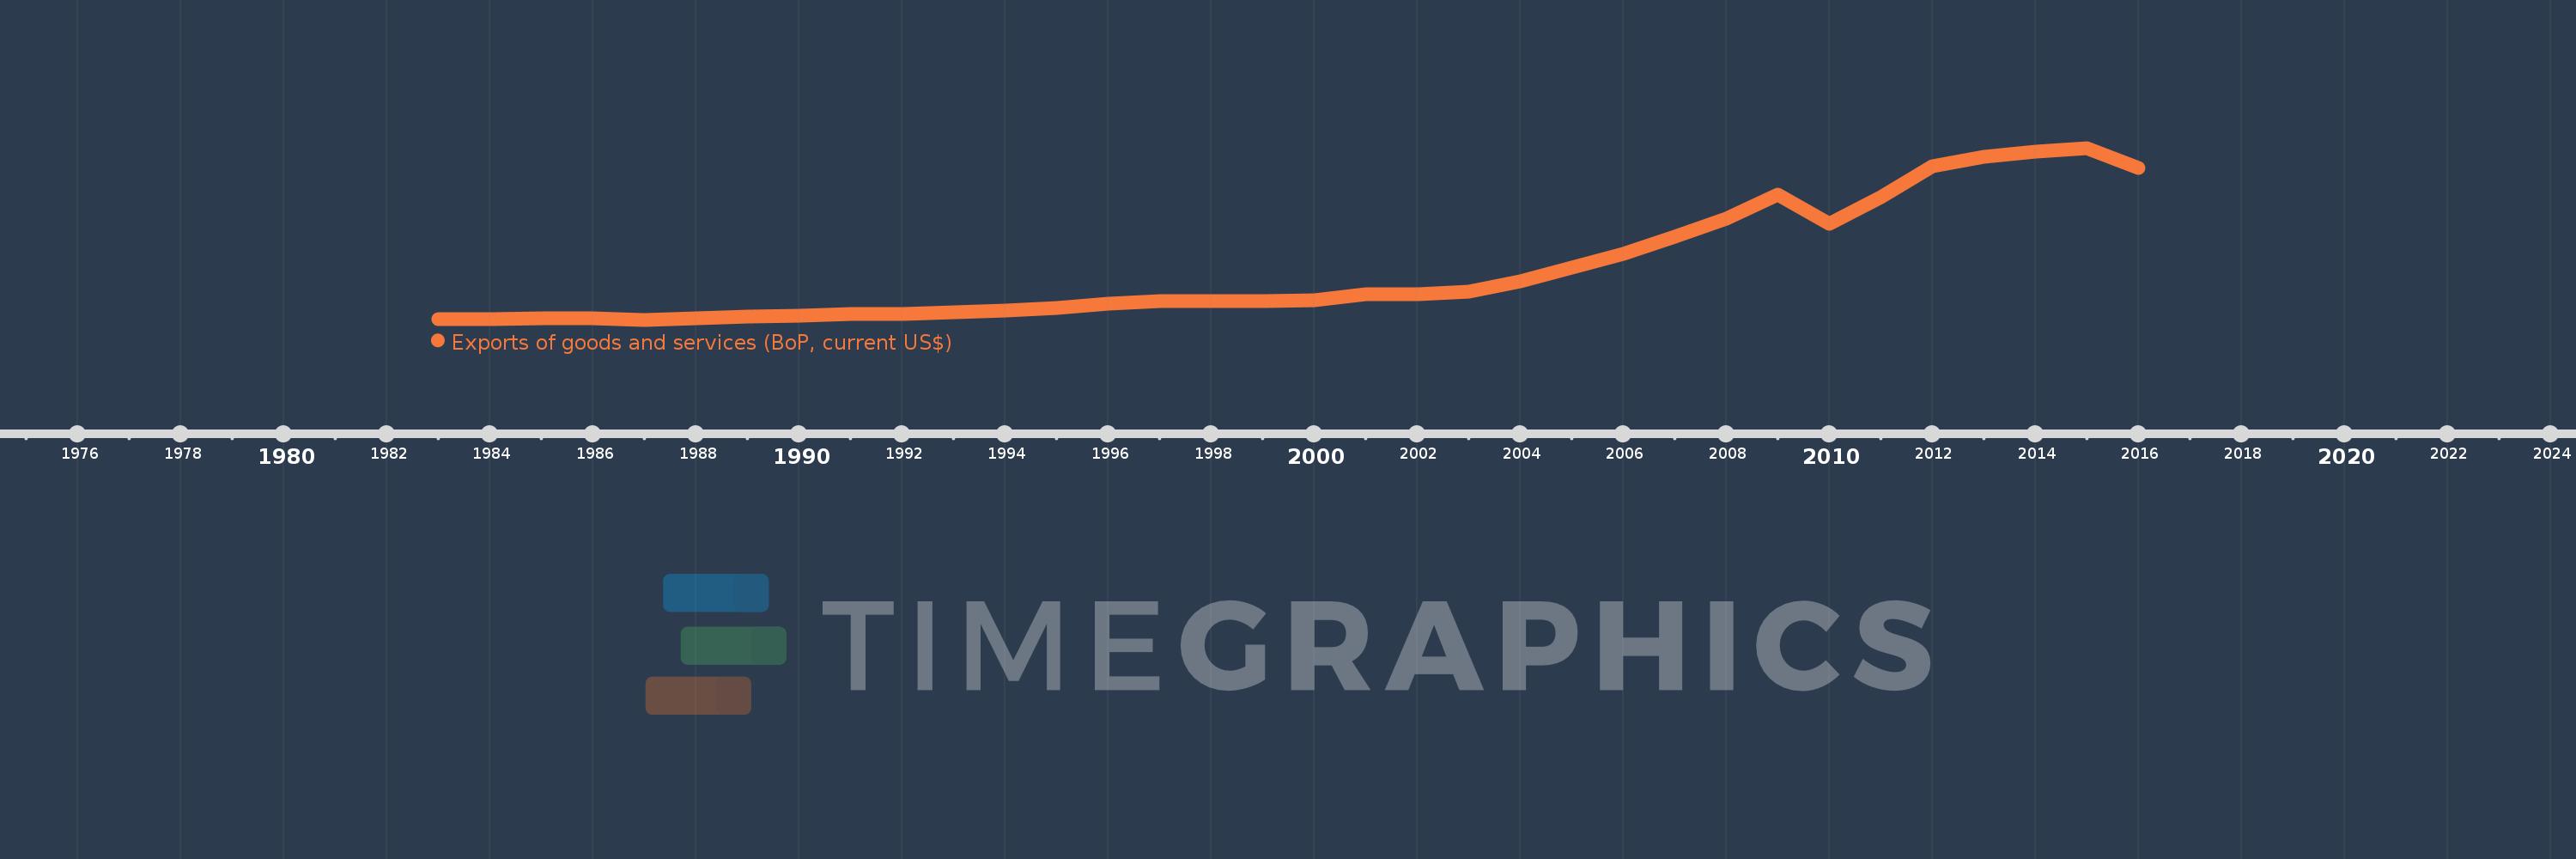
Exports of goods and services (BoP, current US$)
2016,2015,2014,2013,2012,2011,2010,2009,2008,2007,2006,2005,2004,2003,2002,2001,2000,1999,1998,1997,1996,1995,1994,1993,1992,1991,1990,1989,1988,1987,1986,1985,1984,1983
This statistics in other country:
AfghanistanAlbaniaAlgeriaAngolaAntigua and BarbudaArab WorldArgentinaArmeniaArubaAustraliaAustriaAzerbaijanBahamas, TheBahrainBangladeshBarbadosBelarusBelgiumBelizeBeninBermudaBhutanBoliviaBosnia and HerzegovinaBotswanaBrazilBrunei DarussalamBulgariaBurkina FasoBurundiCabo VerdeCambodiaCameroonCanadaCaribbean small statesCentral African RepublicCentral Europe and the BalticsChadChileChinaColombiaComorosCongo, Dem. Rep.Congo, Rep.Costa RicaCote d'IvoireCroatiaCuracaoCyprusCzech RepublicDenmarkDjiboutiDominicaDominican RepublicEarly-demographic dividendEast Asia & PacificEast Asia & Pacific (excluding high income)East Asia & Pacific (IDA & IBRD countries)EcuadorEgypt, Arab Rep.El SalvadorEquatorial GuineaEritreaEstoniaEthiopiaEuro areaEurope & Central AsiaEurope & Central Asia (excluding high income)Europe & Central Asia (IDA & IBRD countries)European UnionFaroe IslandsFijiFinlandFragile and conflict affected situationsFranceFrench PolynesiaGabonGambia, TheGeorgiaGermanyGhanaGreeceGrenadaGuatemalaGuineaGuinea-BissauGuyanaHaitiHeavily indebted poor countries (HIPC)High incomeHondurasHong Kong SAR, ChinaHungaryIBRD onlyIcelandIDA & IBRD totalIDA blendIDA onlyIDA totalIndiaIndonesiaIran, Islamic Rep.IraqIrelandIsraelItalyJamaicaJapanJordanKazakhstanKenyaKiribatiKorea, Rep.KosovoKuwaitKyrgyz RepublicLao PDRLate-demographic dividendLatin America & Caribbean Latin America & Caribbean (excluding high income)Latin America & the Caribbean (IDA & IBRD countries)LatviaLeast developed countries: UN classificationLebanonLesothoLiberiaLibyaLithuaniaLow & middle incomeLow incomeLower middle incomeLuxembourgMacao SAR, ChinaMacedonia, FYRMadagascarMalawiMalaysiaMaldivesMaliMaltaMarshall IslandsMauritaniaMauritiusMexicoMicronesia, Fed. Sts.Middle East & North Africa (excluding high income)Middle East & North Africa (IDA & IBRD countries)Middle incomeMoldovaMongoliaMontenegroMoroccoMozambiqueMyanmarNamibiaNepalNetherlandsNew CaledoniaNicaraguaNigerNigeriaNorth AmericaNorwayOECD membersOmanPacific island small statesPakistanPalauPanamaPapua New GuineaParaguayPeruPhilippinesPolandPortugalPost-demographic dividendPre-demographic dividendQatarRomaniaRussian FederationRwandaSamoaSao Tome and PrincipeSaudi ArabiaSenegalSerbiaSeychellesSierra LeoneSingaporeSint Maarten (Dutch part)Slovak RepublicSloveniaSolomon IslandsSouth AfricaSouth AsiaSouth Asia (IDA & IBRD)South SudanSpainSri LankaSt. Kitts and NevisSt. LuciaSt. Vincent and the GrenadinesSub-Saharan Africa Sub-Saharan Africa (excluding high income)Sub-Saharan Africa (IDA & IBRD countries)SudanSurinameSwazilandSwedenSwitzerlandSyrian Arab RepublicTajikistanTanzaniaThailandTimor-LesteTogoTongaTrinidad and TobagoTunisiaTurkeyTuvaluUgandaUkraineUnited KingdomUnited StatesUpper middle incomeUruguayVanuatuVenezuela, RBVietnamWest Bank and GazaWorldYemen, Rep.ZambiaZimbabwe Timeline:
This timeline shows a graph from 1983 to 2016 of Upper middle income. No data until 1982. Number of actual observations by date: 34.
Source name:
World Development Indicators
Source organization:
International Monetary Fund, Balance of Payments Statistics Yearbook and data files.
Categories, topics:
Economy & Growth, Trade
Last updated:
apr 23, 2017
Indicators value changes by year
Minimum:
261.561 bln
jan 1, 1987
Maximum:
5.873 trl
jan 1, 2015
At the date of observation
Value
Absolute change
Change from previous value
jan 1, 1983
290.961 bln
+290.961 bln
0.0%
jan 1, 1984
292.275 bln
+1.315 bln
0.45%
jan 1, 1985
311.228 bln
+18.953 bln
6.48%
jan 1, 1986
298.953 bln
-12.275 bln
-3.94%
jan 1, 1987
261.561 bln
-37.391 bln
-12.51%
jan 1, 1988
320.848 bln
+59.286 bln
22.67%
jan 1, 1989
357.197 bln
+36.349 bln
11.33%
jan 1, 1990
390.2 bln
+33.003 bln
9.24%
jan 1, 1991
444.307 bln
+54.107 bln
13.87%
jan 1, 1992
460.147 bln
+15.84 bln
3.57%
jan 1, 1993
509.717 bln
+49.57 bln
10.77%
jan 1, 1994
551.127 bln
+41.41 bln
8.12%
jan 1, 1995
650.965 bln
+99.838 bln
18.12%
jan 1, 1996
785.726 bln
+134.761 bln
20.7%
jan 1, 1997
876.183 bln
+90.457 bln
11.51%
jan 1, 1998
870.733 bln
-5.45 bln
-0.62%
jan 1, 1999
866.924 bln
-3.809 bln
-0.44%
jan 1, 2000
907.542 bln
+40.617 bln
4.69%
jan 1, 2001
1.108 trl
+200.014 bln
22.04%
jan 1, 2002
1.091 trl
-16.422 bln
-1.48%
jan 1, 2003
1.171 trl
+79.562 bln
7.29%
jan 1, 2004
1.528 trl
+356.845 bln
30.48%
jan 1, 2005
1.966 trl
+438.523 bln
28.71%
jan 1, 2006
2.426 trl
+460.04 bln
23.4%
jan 1, 2007
2.965 trl
+538.578 bln
22.2%
jan 1, 2008
3.576 trl
+610.894 bln
20.61%
jan 1, 2009
4.352 trl
+776.307 bln
21.71%
jan 1, 2010
3.403 trl
-948.958 bln
-21.81%
jan 1, 2011
4.272 trl
+868.855 bln
25.53%
jan 1, 2012
5.278 trl
+1.006 trl
23.56%
jan 1, 2013
5.573 trl
+295.005 bln
5.59%
jan 1, 2014
5.756 trl
+183.254 bln
3.29%
jan 1, 2015
5.873 trl
+116.59 bln
2.03%
jan 1, 2016
5.219 trl
-654.003 bln
-11.14%
Ranking of countries by current statistics by years


Comments: