29
/
en
AIzaSyAYiBZKx7MnpbEhh9jyipgxe19OcubqV5w
April 1, 2024
154525
India
IND
true
2
1
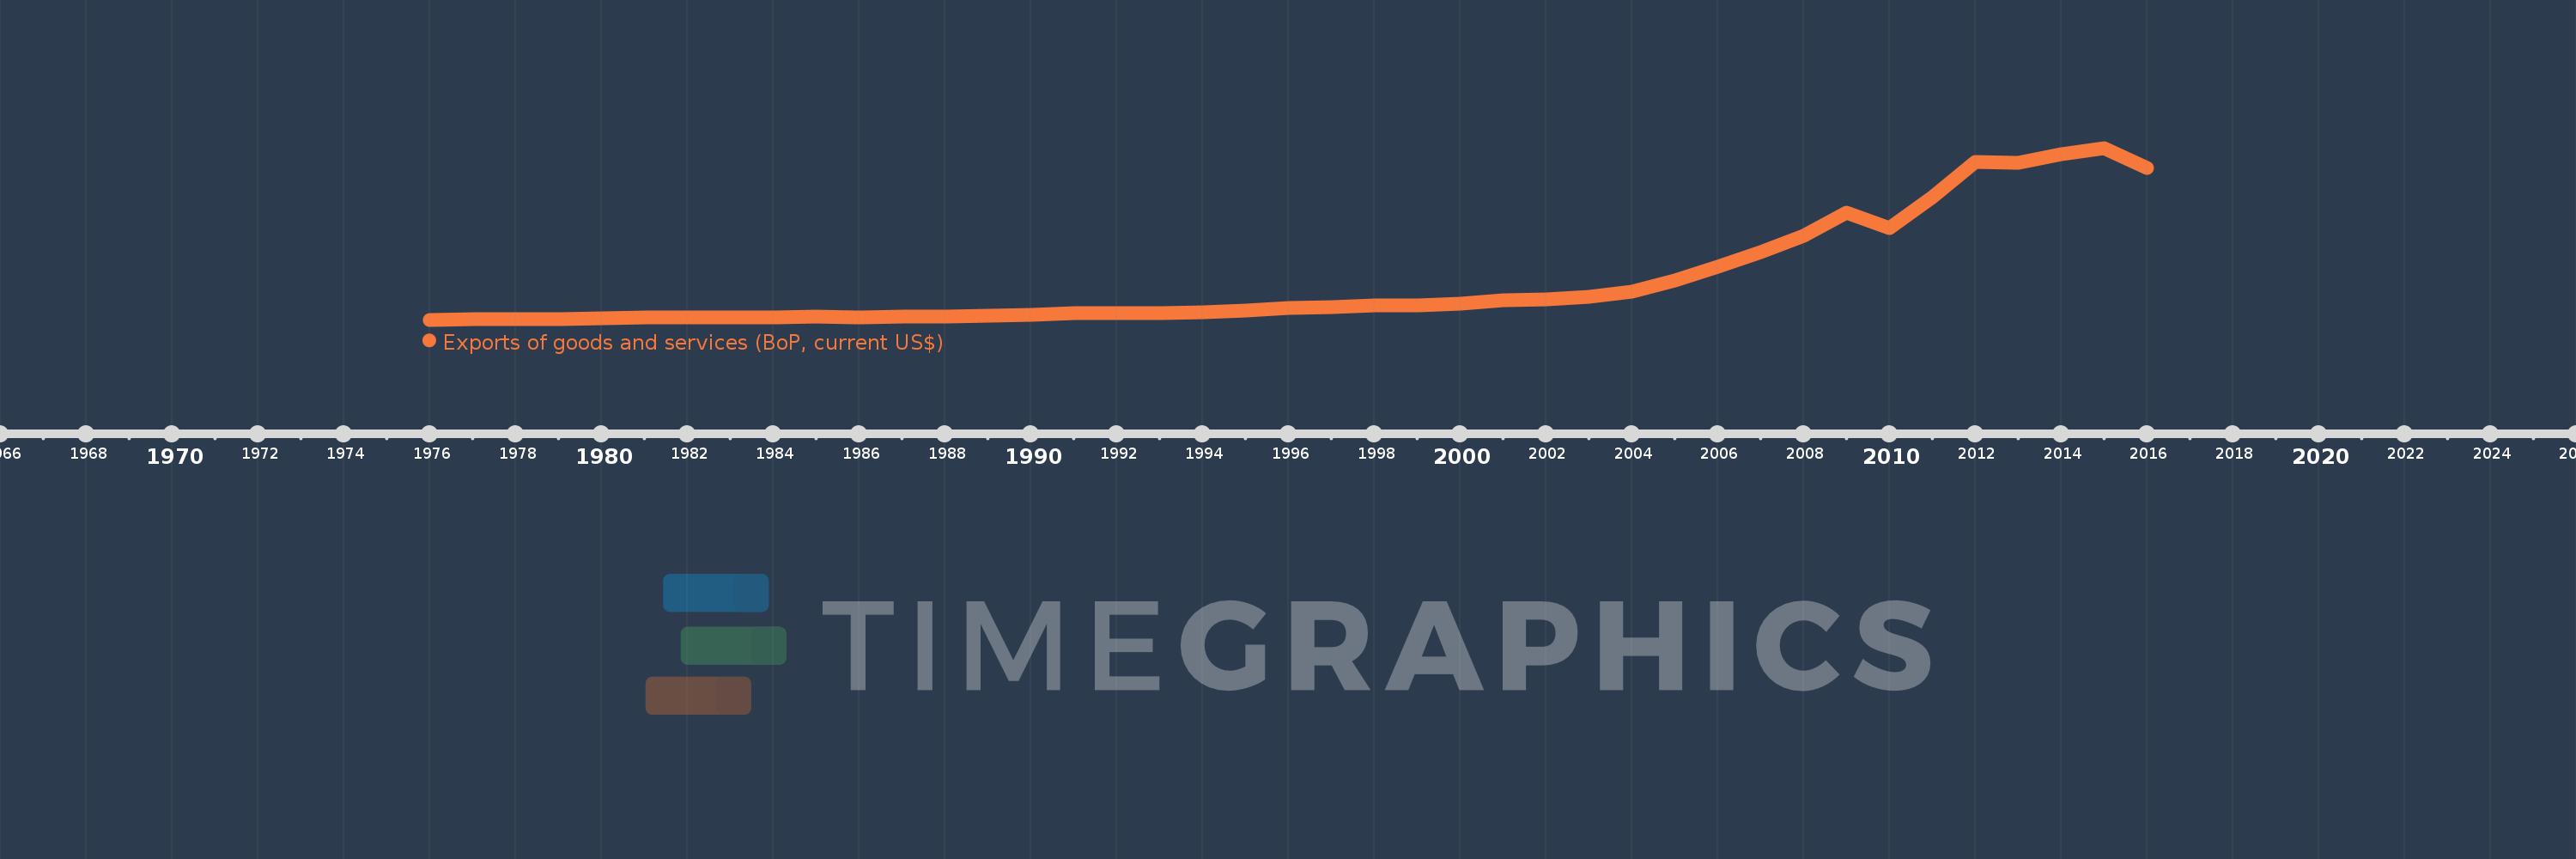
Exports of goods and services (BoP, current US$)
2016,2015,2014,2013,2012,2011,2010,2009,2008,2007,2006,2005,2004,2003,2002,2001,2000,1999,1998,1997,1996,1995,1994,1993,1992,1991,1990,1989,1988,1987,1986,1985,1984,1983,1982,1981,1980,1979,1978,1977,1976
This statistics in other country:
AfghanistanAlbaniaAlgeriaAngolaAntigua and BarbudaArab WorldArgentinaArmeniaArubaAustraliaAustriaAzerbaijanBahamas, TheBahrainBangladeshBarbadosBelarusBelgiumBelizeBeninBermudaBhutanBoliviaBosnia and HerzegovinaBotswanaBrazilBrunei DarussalamBulgariaBurkina FasoBurundiCabo VerdeCambodiaCameroonCanadaCaribbean small statesCentral African RepublicCentral Europe and the BalticsChadChileChinaColombiaComorosCongo, Dem. Rep.Congo, Rep.Costa RicaCote d'IvoireCroatiaCuracaoCyprusCzech RepublicDenmarkDjiboutiDominicaDominican RepublicEarly-demographic dividendEast Asia & PacificEast Asia & Pacific (excluding high income)East Asia & Pacific (IDA & IBRD countries)EcuadorEgypt, Arab Rep.El SalvadorEquatorial GuineaEritreaEstoniaEthiopiaEuro areaEurope & Central AsiaEurope & Central Asia (excluding high income)Europe & Central Asia (IDA & IBRD countries)European UnionFaroe IslandsFijiFinlandFragile and conflict affected situationsFranceFrench PolynesiaGabonGambia, TheGeorgiaGermanyGhanaGreeceGrenadaGuatemalaGuineaGuinea-BissauGuyanaHaitiHeavily indebted poor countries (HIPC)High incomeHondurasHong Kong SAR, ChinaHungaryIBRD onlyIcelandIDA & IBRD totalIDA blendIDA onlyIDA totalIndiaIndonesiaIran, Islamic Rep.IraqIrelandIsraelItalyJamaicaJapanJordanKazakhstanKenyaKiribatiKorea, Rep.KosovoKuwaitKyrgyz RepublicLao PDRLate-demographic dividendLatin America & Caribbean Latin America & Caribbean (excluding high income)Latin America & the Caribbean (IDA & IBRD countries)LatviaLeast developed countries: UN classificationLebanonLesothoLiberiaLibyaLithuaniaLow & middle incomeLow incomeLower middle incomeLuxembourgMacao SAR, ChinaMacedonia, FYRMadagascarMalawiMalaysiaMaldivesMaliMaltaMarshall IslandsMauritaniaMauritiusMexicoMicronesia, Fed. Sts.Middle East & North Africa (excluding high income)Middle East & North Africa (IDA & IBRD countries)Middle incomeMoldovaMongoliaMontenegroMoroccoMozambiqueMyanmarNamibiaNepalNetherlandsNew CaledoniaNicaraguaNigerNigeriaNorth AmericaNorwayOECD membersOmanPacific island small statesPakistanPalauPanamaPapua New GuineaParaguayPeruPhilippinesPolandPortugalPost-demographic dividendPre-demographic dividendQatarRomaniaRussian FederationRwandaSamoaSao Tome and PrincipeSaudi ArabiaSenegalSerbiaSeychellesSierra LeoneSingaporeSint Maarten (Dutch part)Slovak RepublicSloveniaSolomon IslandsSouth AfricaSouth AsiaSouth Asia (IDA & IBRD)South SudanSpainSri LankaSt. Kitts and NevisSt. LuciaSt. Vincent and the GrenadinesSub-Saharan Africa Sub-Saharan Africa (excluding high income)Sub-Saharan Africa (IDA & IBRD countries)SudanSurinameSwazilandSwedenSwitzerlandSyrian Arab RepublicTajikistanTanzaniaThailandTimor-LesteTogoTongaTrinidad and TobagoTunisiaTurkeyTuvaluUgandaUkraineUnited KingdomUnited StatesUpper middle incomeUruguayVanuatuVenezuela, RBVietnamWest Bank and GazaWorldYemen, Rep.ZambiaZimbabwe Timeline:
This timeline shows a graph from 1976 to 2016 of India. No data until 1975. Number of actual observations by date: 41.
Source name:
World Development Indicators
Source organization:
International Monetary Fund, Balance of Payments Statistics Yearbook and data files.
Categories, topics:
Economy & Growth, Trade
Last updated:
apr 23, 2017
Indicators value changes by year
Minimum:
5.507 bln
jan 1, 1976
Maximum:
485.583 bln
jan 1, 2015
At the date of observation
Value
Absolute change
Change from previous value
jan 1, 1976
5.507 bln
+5.507 bln
0.0%
jan 1, 1977
6.466 bln
+959.475 mln
17.42%
jan 1, 1978
7.566 bln
+1.099 bln
17.0%
jan 1, 1979
8.125 bln
+559.018 mln
7.39%
jan 1, 1980
9.68 bln
+1.555 bln
19.14%
jan 1, 1981
11.274 bln
+1.594 bln
16.47%
jan 1, 1982
11.235 bln
-39.687 mln
-0.35%
jan 1, 1983
12.159 bln
+924.318 mln
8.23%
jan 1, 1984
13.06 bln
+900.961 mln
7.41%
jan 1, 1985
13.424 bln
+363.619 mln
2.78%
jan 1, 1986
12.849 bln
-574.404 mln
-4.28%
jan 1, 1987
13.476 bln
+627.07 mln
4.88%
jan 1, 1988
15.247 bln
+1.771 bln
13.14%
jan 1, 1989
17.301 bln
+2.054 bln
13.47%
jan 1, 1990
20.284 bln
+2.983 bln
17.24%
jan 1, 1991
22.911 bln
+2.627 bln
12.95%
jan 1, 1992
23.02 bln
+109.291 mln
0.48%
jan 1, 1993
24.953 bln
+1.933 bln
8.4%
jan 1, 1994
27.123 bln
+2.169 bln
8.69%
jan 1, 1995
31.561 bln
+4.438 bln
16.36%
jan 1, 1996
38.013 bln
+6.453 bln
20.44%
jan 1, 1997
40.976 bln
+2.962 bln
7.79%
jan 1, 1998
44.813 bln
+3.837 bln
9.36%
jan 1, 1999
45.767 bln
+954.184 mln
2.13%
jan 1, 2000
51.386 bln
+5.619 bln
12.28%
jan 1, 2001
59.932 bln
+8.545 bln
16.63%
jan 1, 2002
62.13 bln
+2.199 bln
3.67%
jan 1, 2003
70.619 bln
+8.489 bln
13.66%
jan 1, 2004
84.795 bln
+14.176 bln
20.07%
jan 1, 2005
116.02 bln
+31.225 bln
36.82%
jan 1, 2006
154.582 bln
+38.562 bln
33.24%
jan 1, 2007
193.316 bln
+38.734 bln
25.06%
jan 1, 2008
240.082 bln
+46.766 bln
24.19%
jan 1, 2009
305.119 bln
+65.037 bln
27.09%
jan 1, 2010
260.847 bln
-44.272 bln
-14.51%
jan 1, 2011
348.035 bln
+87.188 bln
33.43%
jan 1, 2012
446.375 bln
+98.34 bln
28.26%
jan 1, 2013
443.845 bln
-2.53 bln
-0.57%
jan 1, 2014
468.273 bln
+24.428 bln
5.5%
jan 1, 2015
485.583 bln
+17.31 bln
3.7%
jan 1, 2016
428.631 bln
-56.952 bln
-11.73%
Ranking of countries by current statistics by years


Comments: